LAB – Interference, Entanglement and Quantum-Enhanced Metrology#
This lab will: (1) explore the fundamental properties of quantum particles using quantum optics; (2) explore the interactions of quantum particles through interference; and (3) demonstrate how these interactions can be exploited to engineer devices for quantum-enhanced sensing. In particular we will show how quantum states of light can be engineered to provide improved detection of changes in displacement (for example small physical movements of one object relative to another).
Specific aims are:
Introduction to the quantenkoffer
Understand SPDC photon pair generation, allignment, and coincidence measurements
Use the properties of coincidence detection to measure the speed of light
Demonstrate polarization entanglement between two photons
Explore interference of a photon with itself
Explore the interference of two single photons: the Hong-Ou-Mandel effect
BONUS/Project Idea Develop a NOON state interferometer demonstrating supersensitivty to path length changes.
Note
Throughout the labs you will be expected to keep notes. This is important for both collecting, analyzing, and gathering your own thoughts about observations and data collected. You will use these notes to develop your final writeup. You can work together on their collection and in answering questions. All questions and action items to be addressed in your writeups are marked with AI below.
Aim 1: Introduction to the Quantenkoffer (Day 1)#
In this lab you will be using the Quantenkoffer. This instrument will allow us to explore the properties of single photons and pairs of entangled photons.
Before the lab, we have already introduced you to the system and guided you through the basics of the interface and entangled photon source. Take 10-15 minutes to explore the instrument a bit. Look through the menus, the differnt options, the different bricks available, etc. Ask your instructor about things you are confused about. There is also a manual along with the online materials you can use.
Aim 2: Understand SPDC generation of entangled photon pairs (Day 1)#
In this exercise we will explore the spontaneous parametric down-conversion (SPDC) source of the Quantenkoffer.
Before Getting Started#
The source is shown in Fig. 14. A useful animation of the source and detailed description is provided on the QuTools website.
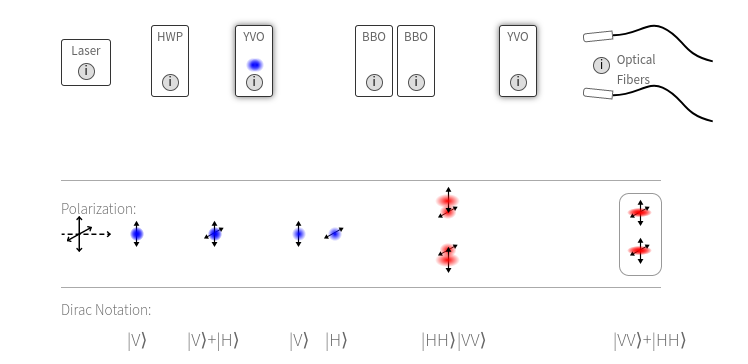
Fig. 14 A schematic view of the Quantenkoffer’s SPDC source.#
For more information about the source, you can read about SPDC generation here, and watch this video demonstration.
Lab Exercise#
In the followign steps you will learn about the Quantenkoffer SPDC source through the detection of coincidence events.
After turning the quantenkoffer on, place a periscope on each source port at the left side. Thes bring up the underlying source photons in each path \(A\) and \(B\) to the surface.
Now place a periscope on the two detector ports. These send the photons in \(A\) and \(B\) down to the single-photon detectors housed under the board.
Tap the top of either source perisocope on the left to activate the source view on the control pad. Adjust the mirrors A1, A2, and B1 and B2 to optimize the count rates on both detectors. (Tip: if the system seems far out of alignment, you can use the adjustement laser at very low power, a few percent, to help get started here).
Now, focusing on coincidence events (A and B), adjust the same mirrors to optimize coincidence counts. This might result in slightly less than optimum total counts. Tha is OK. What we are doing is ensuring that we optimize for selection of entangled photon pairs for later experiments.
Once you have completed these steps, your setup should look like that in Fig. 15. Typical values might be \(3\times10^5\) total counts in A and B, with \(1.5\times10^4\) coincidence counts. You should not proceed until you get at least \(1\times10^4\) coincidence counts.
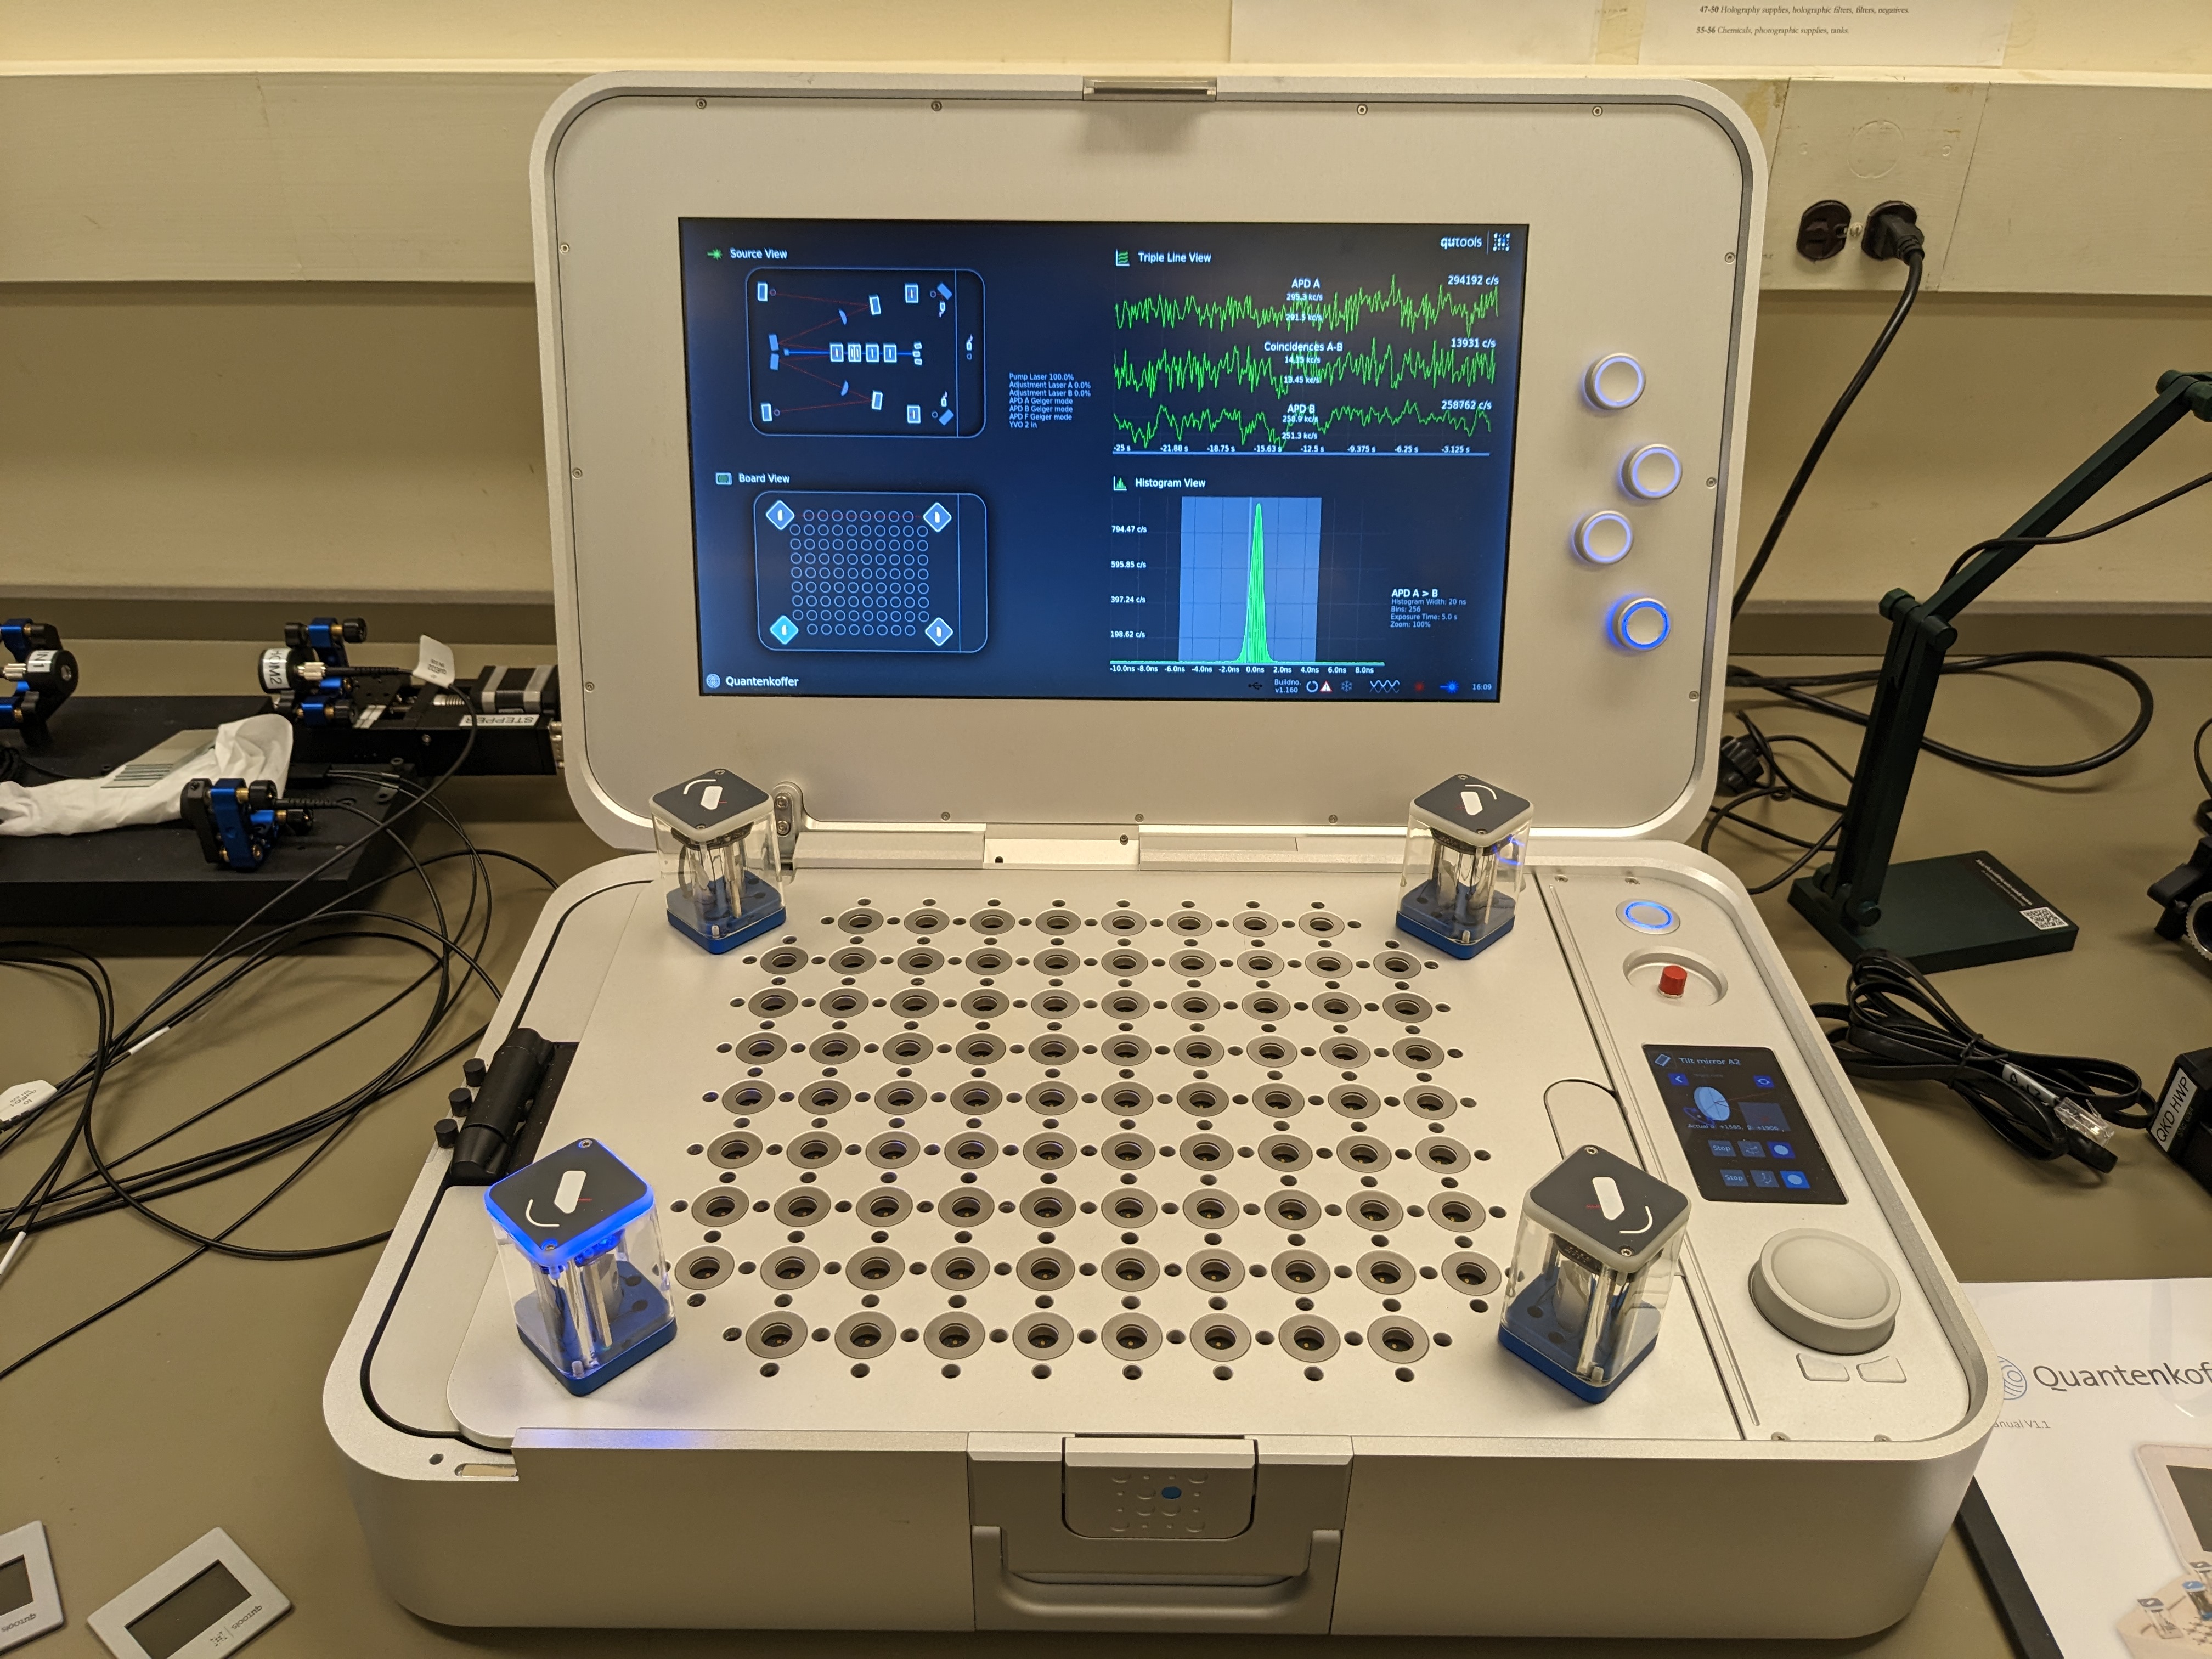
Fig. 15 What your setup should look like for coincidence detection of the SPDC photons. Note that there are between 250K to 300K single electron events in each arm with 14K coincidence events in the image. In the histogram view, you should see a strong peak near 0 seconds. This value can be tuned with the APD delay settings.#
What we have been doing is ensuring that we have selected the correct locations of the output cone angles from the SPDC crystal that correspond to photon pair locations (read more about the SPDC generation here). There are many options for optimizing the counts in detector A or B from either cone of the SPDC output, but only two relative locations will give true pairs of entangled photons.
AI Record your count rates and coincidence counts. What is the ratio? Think through and discuss why the experimental coincidence count rates are lower than the single counts on either detector alone, and how this ratio might be improved through engineering.
AI What is the duration of the coincidence peak in your histogram window? Do you think this duration is due to the true coincidence timing window of the photons, or to technical limitations (e.g. detector rise/fall time, or other systematic causes)?
Aim 3: Understanding Coincidence Detection – Speed of Light Measurement (Day 1)#
The purpose of this aim is to think more critically about the histogram and how it is being compiled. To do this, we will put it to use to measure the speed of light. In terms of experimental capabilities, you will learn how to align two beams such that they are perfectly overlapped in space after a beam-combiner (i.e. along the exact same line). We will use this skill a lot as we move forward when aligning interferometers.
Given the short duration of the coincidence histogram peak in time, we can use it to measure the speed of light as the photons travel across the board. We can do this by splitting off some photons in one arm so that they travel a longer distance than the other – those photons then experience a longer delay time before making it to the detector. Thus, when looking for coincidences, we now will find a double-peaked histogram.
AI Based on the histogram peak duration you measured, how much spatial distance between photons would you need in order to discern two peaks?
Instructions#
Activate the adjustment laser to full power so you can see it.
Starting from your aligned source in Aim 1, add in a beamsplitter to one of the paths.
Using the target block with cross-hairs, align the beam to a separate point at the location you will place a first 45 degree mirror as shown in Fig. 16. After alignment, place the lower-left mirror on the board.
Repeat step (2) at the location of the second 45 degree mirror and then add the second mirror.
Now add in a second beamsplitter for combining the two paths just in front of the path \(A\) detector periscope.
Use a dark object to block your newly created beampath. Using the path \(A\) source mirrors, optimize the top path into the detector. This ensures that this path is perfectly aligned, and we now simply need to make our new path take this exact same trajectory.
We now need to make sure the two paths are perfectly overlapped in space (i.e. that they lie on the exact same line after the second beamsplitter). To do this we need to adjust the beams so that they are overlapped at the beamsplitter and at some distant point. Place a card behind the beamsplitter on the quantenkoffer display panel, or just use the display panel surface. Use the second 45 deg mirror, align the two red beams so they are overlapped (see Fig. 17)
Remove the periscope and project the red beams on a distant target (e.g. a white panel or wall). Now use the second beamsplitter to align the two beams so they overlap (see Fig. 18).
Repeat (6) and (7) until no adjustement is needed.
In this final part, we now go back to observing the histogram. In the coincidence histogram, you should now see two peaks. If not, or if one is faint, you can fine adjust the mirror and beamsplitter from (6) and (7) to achieve a balanced two-peak structure (however, this is not strictly needed for this measurement).
Using the cursors in the histogram view, determine the temporal spacing of the two peaks and record this value along with the histogram trace.
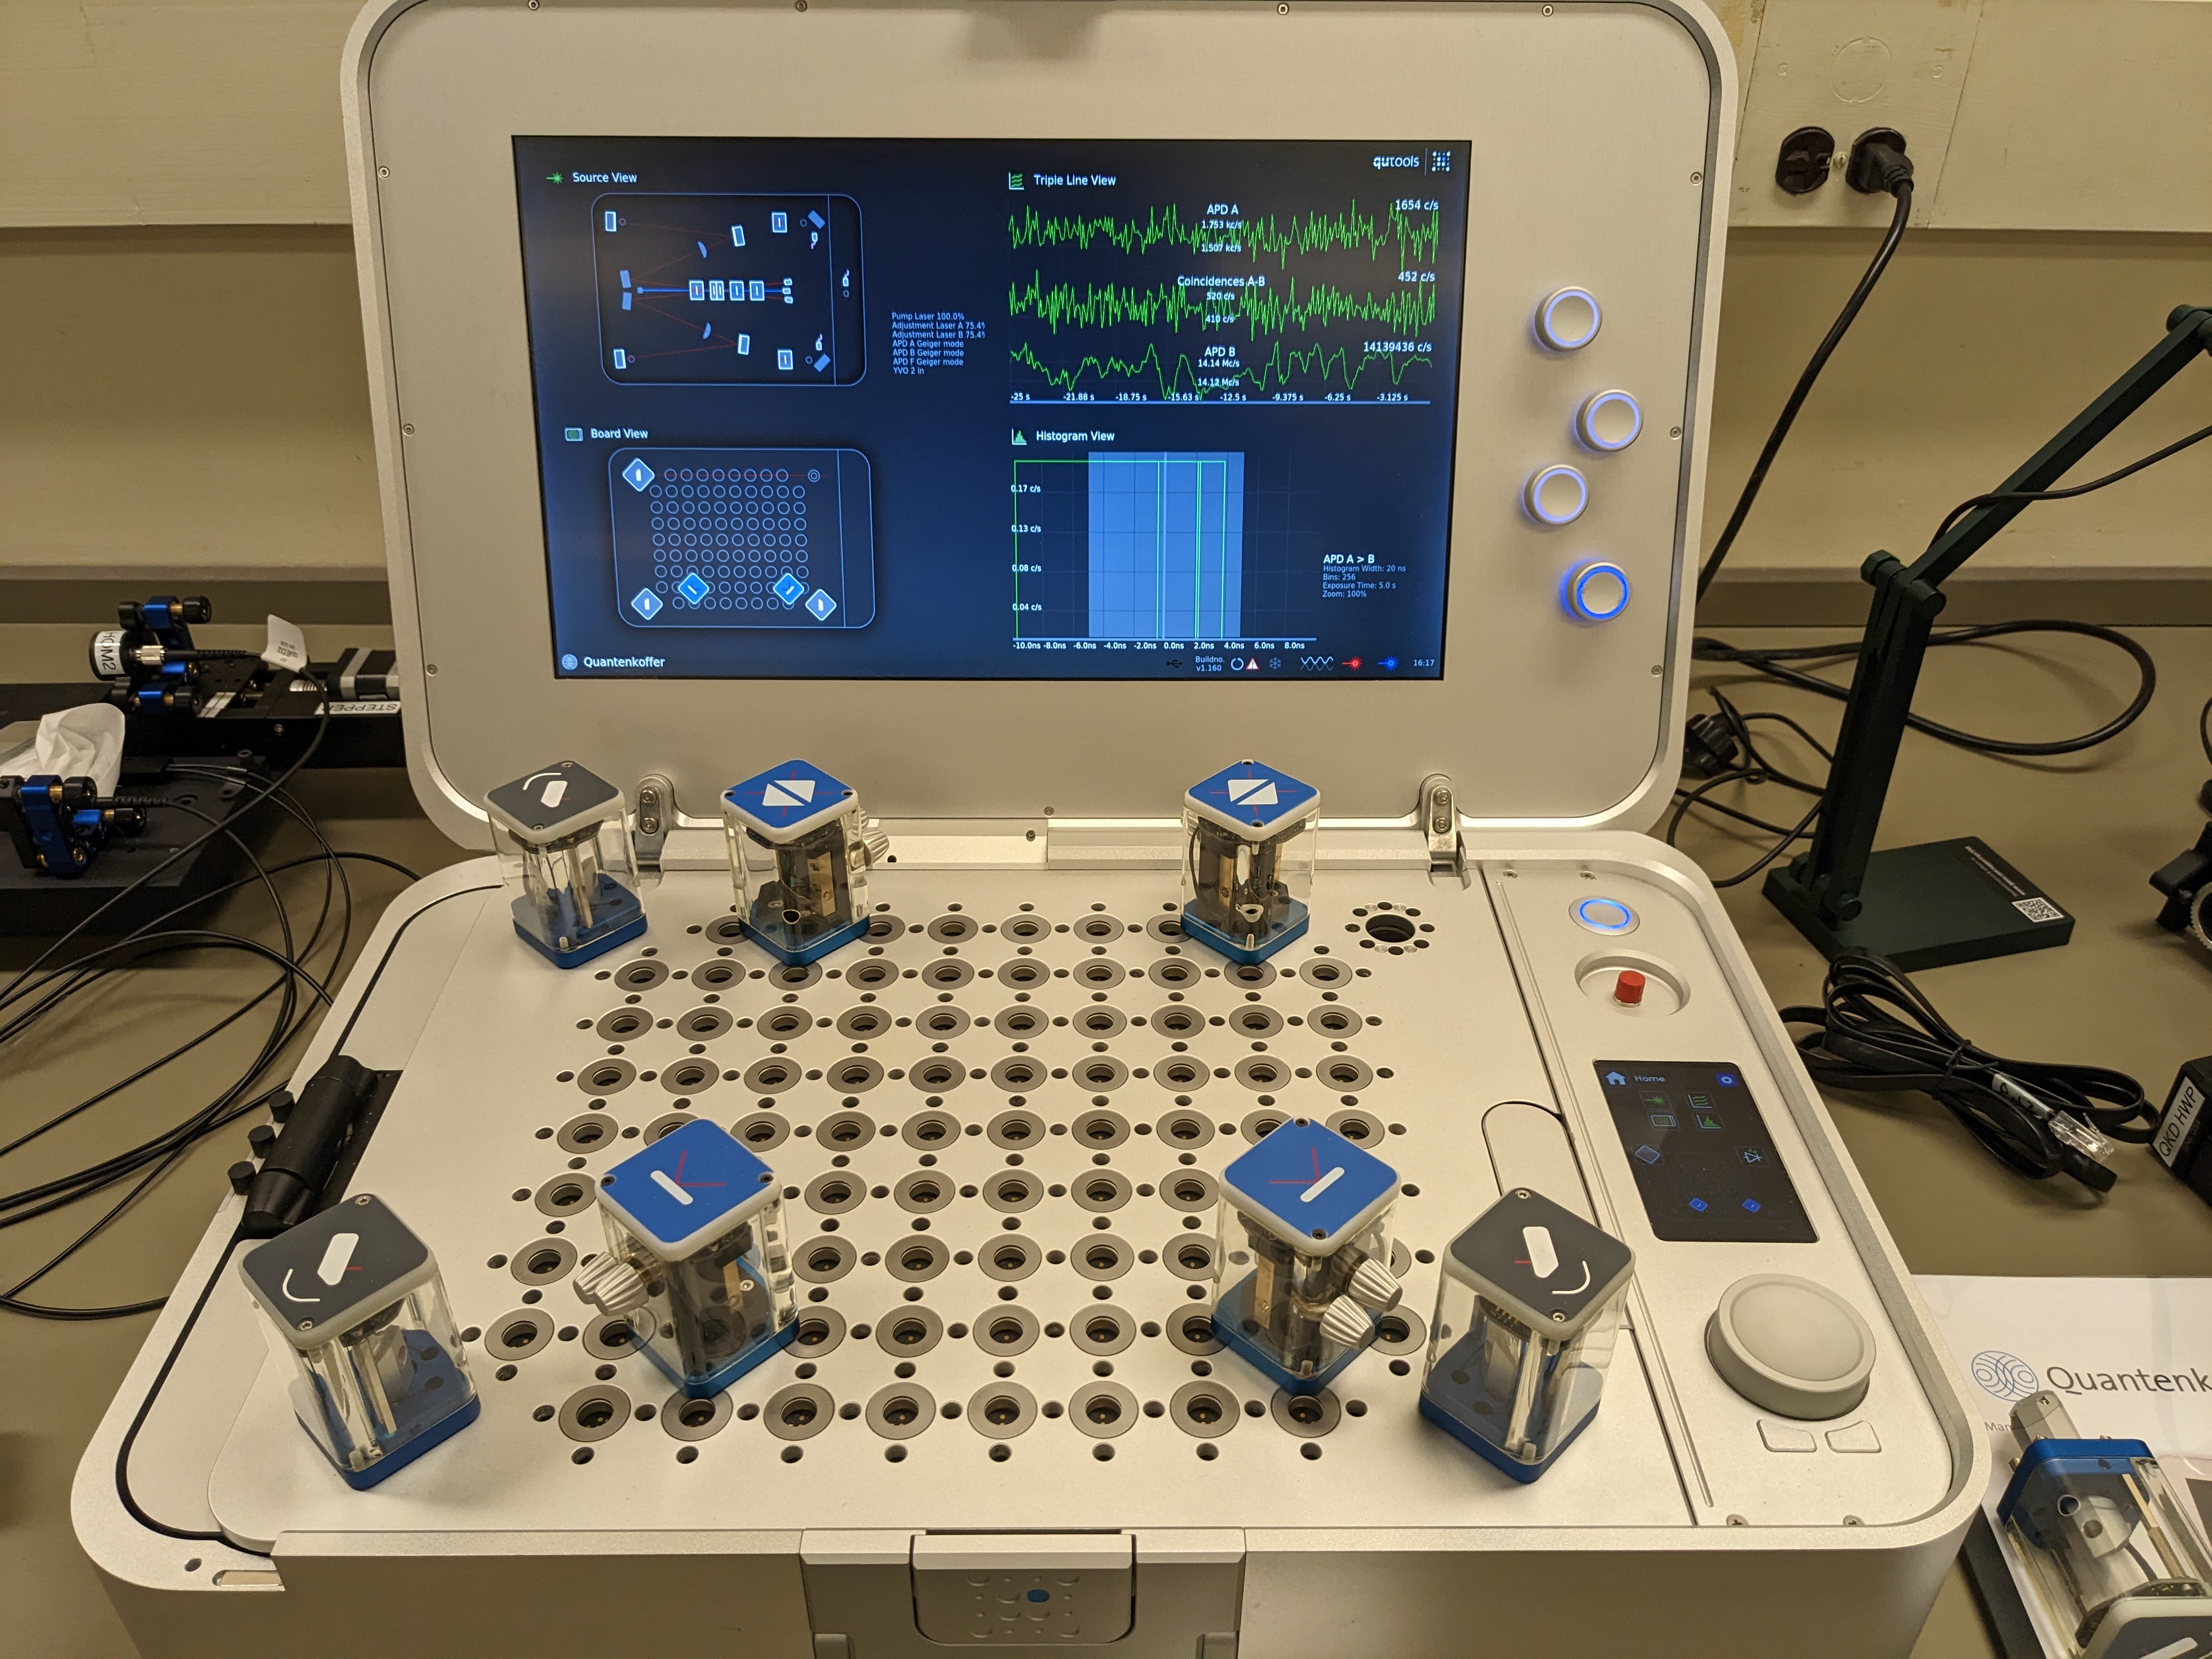
Fig. 16 An example speed of light test setup. Path A has been split into two paths. The lower path takes a longer distance before recombining at the beamsplitter and being directed to the detector.#
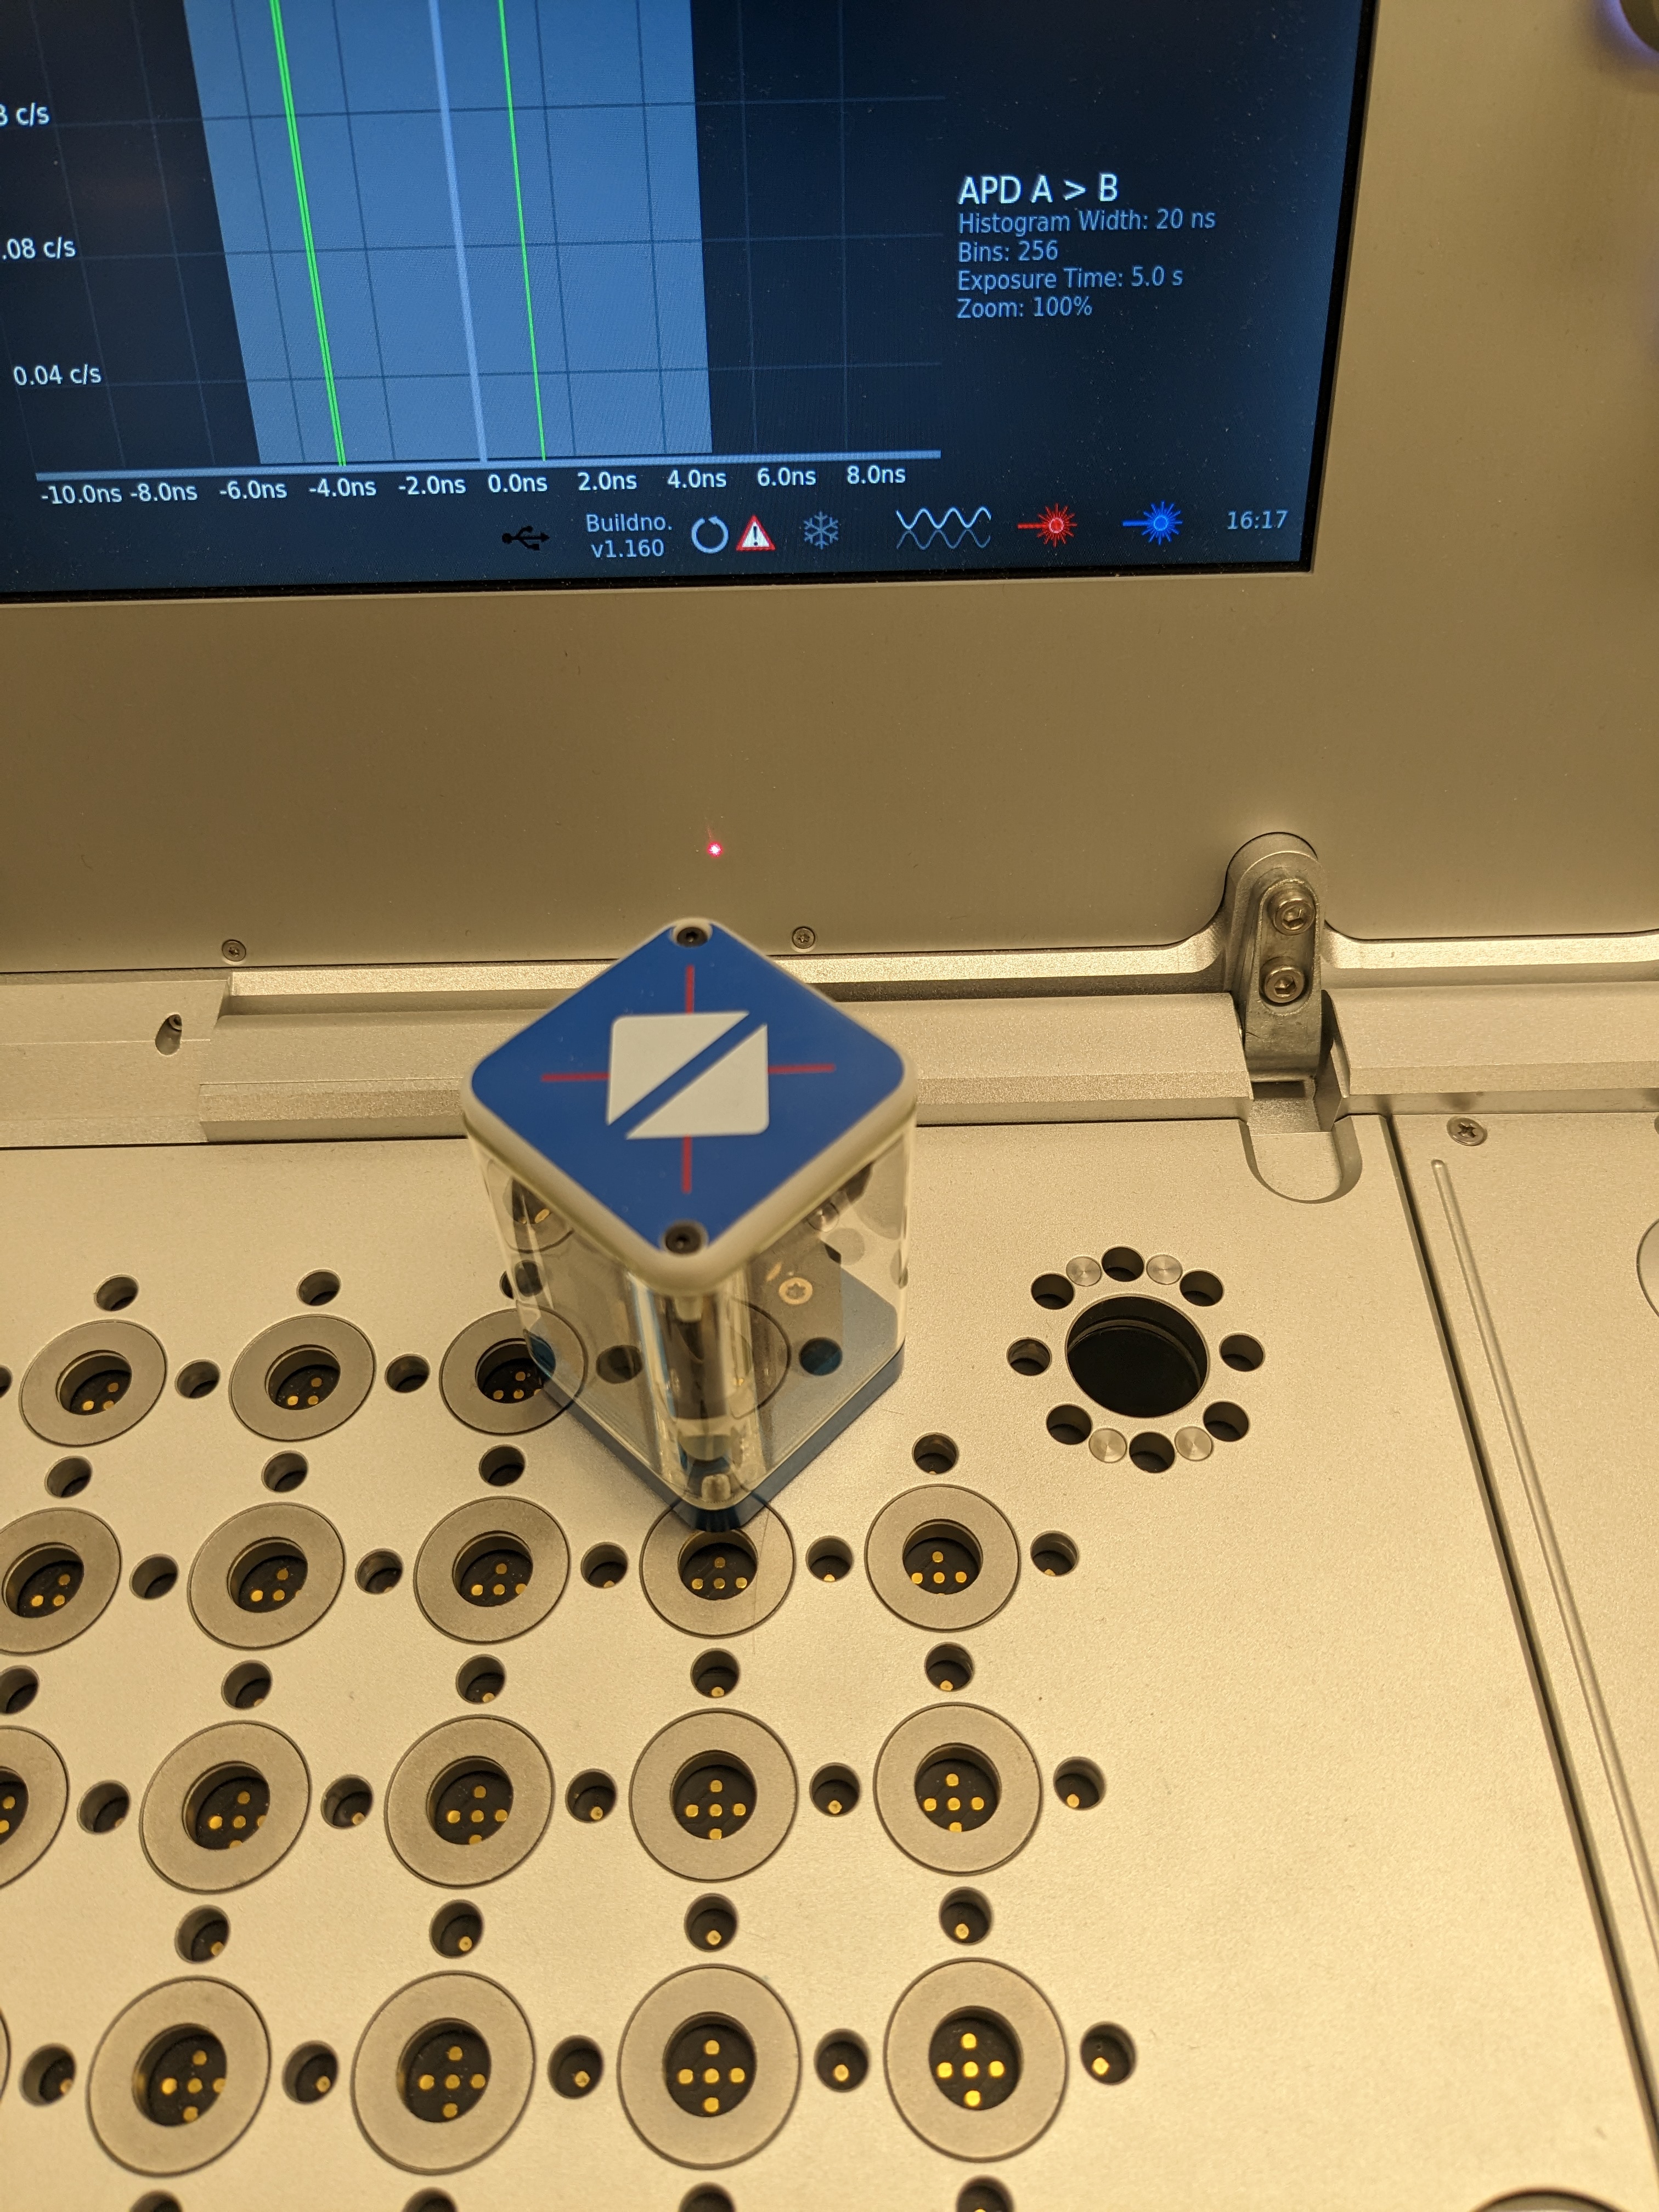
Fig. 17 Near-field alignment. If you see two distinct points, use the second 45 degree mirror to overlap them.#
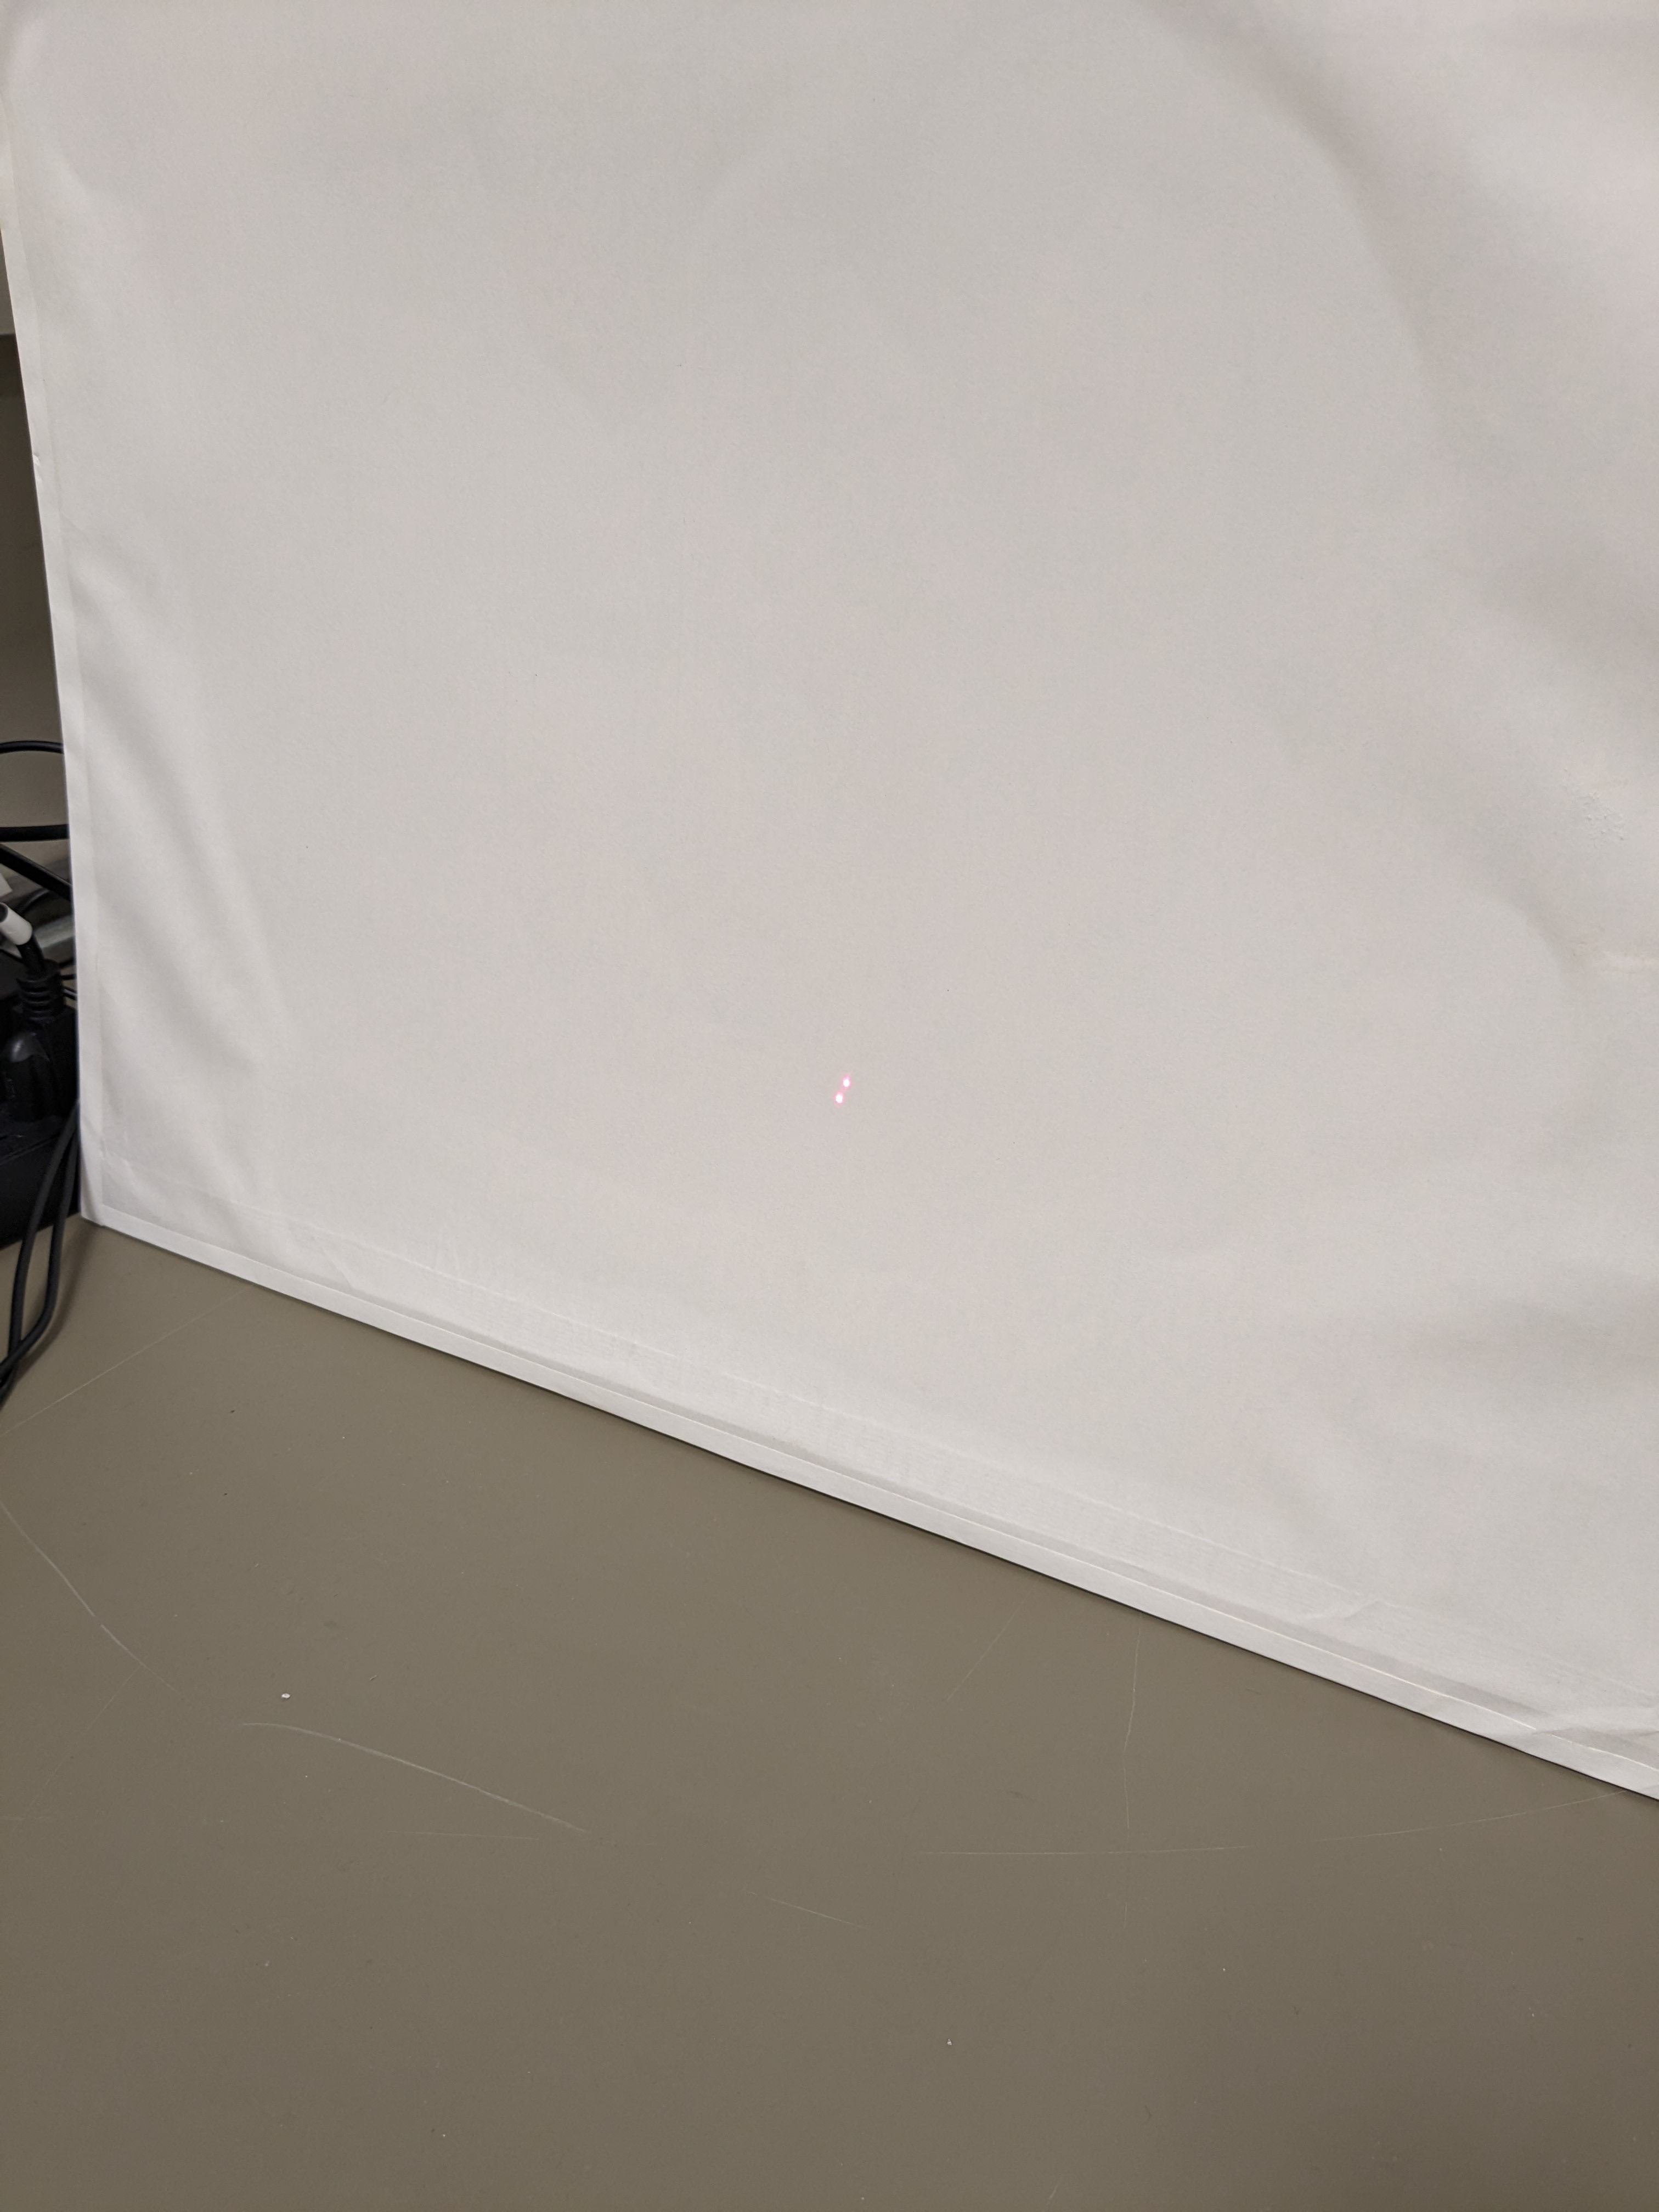
Fig. 18 Far-field alignment. You will see two points that you will need to overlap with the second beamsplitter adjustment.#
AI Record all information you measured, and verify that the delay measurement you made makes sense (you will need to make some distance measurements on the board for this).
Aim 4: Demonstration of Polarization Entanglement (Day 2)#
In this exercise we will use the quantenkoffer to explore the nature of the polarization-entnagled SPDC photon source. By making quite simple polarization measurements in each arm of the detector using polarizers, you can get a hands-on feeling for the entangled nature of the source. While these measurements are simple, they offer a lot to think about.
Instructions#
Watch the video above related to the concepts we will explore in this part, and for a description of the general setup.
Optimize the conicidence count in each arm without any elements on the board as in Aim 1 if needed (e.g. coincidence count lower than 10K counts per second).
Place a polarizer block in each path.
Set up a polar plot dialog on the display panel in one of the display quadrants (make sure you leave the triple line plot showing counts on detectors \(A\), coincidences, and \(B\)).
In the polar plot setting, set it to track the coincidence count rate in detectors \(A\) and \(B\) as a function of the polarizer rotation (note when you select the polarizer element, you will need to use the up-arrow to select the on-board polarizer in \(B\)).
Tap the polarizer in \(B\) and activate its rotation. You should now see the coincidence count rate in detectors \(A\) and \(B\) as a function of the polarizer rotation in \(B\).
AIs (1) Describe the shape of the polar plot you see. (2) Record several polar plots for two or three discrete values of the polarizer in \(A\). (3) Explain why you see what you see and how it indicates polarization entanglement of the source (compare to your pre-lab). (4) What happens to the coincidence trace when you rotate the polarizer in \(A\) manually? (5) If you add another polar plot to track the total photon count rate in \(B\) as a function of the polarizer angle in \(B\) what is the shape? (6) Explain why you observe these two patterns. Think about this last question in the context of the source state and how it evolves through the system and is eventually detected. Hint: what would a \(\ket{H}_a\ket{H}_b\) state look like after absorption of the \(H\)-polarized photon in \(B\)?
Now tap a source periscope to bring up the source controls.
Adjust the initial source half waveplate to be in the (H)orizontal position (see Fig. 19 for the half waveplate control selection). This causes only vertical photon pairs to be generated in the SPDC source: \(\ket{V}_a\ket{V}_b\).
AIs Repeat the action items in step 7 for this source configuration.
AIs Adjust the source half waveplate to (V)ertical. What is the state of the output photons now? Repeat (10).
AI Explain your results in steps (10) and (11) using analytical analysis similar to what you performed for the prelab, and in the context of polarization entanglement.
As a final step add in two half waveplates before the polarizers in both paths \(A\) and \(B\). Leave the source vertically-polarized such that you only generate the \(\ket{H}_a\ket{H}_b\) state. Orient the half waveplates each to 22.5 degrees. This creates equal amounts of \(H\) and \(V\) polarization components in each arm – but is there polarization entanglement?
AIs (1) Measure the total photon count rate in \(B\) as a function of rotation of the polarizer in \(B\). (2) Now measure the coincidence count rate as a function of rotation of the polarizer in \(B\). (3) Check for any dependence on the orientation of the polarizer in \(A\). (4) Do you see any sign of polarization entanglement when looking at the coincidences? Why or why not? What do you see? Explain what is going on. (To explain your answer, calculate the probability of coincidences using the same method in the pre-lab, but now accounting for the input state \(\ket{H}_a\ket{H}_b\) and accounting for the half waveplates in each arm. Note that a half waveplate at 22.5 degrees converts \(\ket{H}\) into \(\frac{1}{\sqrt{2}} \lbrace \ket{H} + \ket{V} \rbrace\) to within a constant phase factor.)
(Calculation/Simulation). This step and the next will be calculation/simulation. Calculate/simulate what would happen if you replaced the half waveplates with quarter waveplates – one in path \(A\) and one in path \(B\). Take that the waveplates are oriented at 45 degrees to generate circularly-polarized light. Note that after \(\ket{H}\) interacts with the quarter waveplate it’s state transforms to \(\frac{1}{\sqrt{2}}\lbrace j\ket{H} + \ket{V}\rbrace\) (to within a constant phase factor).
AIs Based on our calculations/simulation in step 15 with a quarter waveplate added to each arm: (1) What would you see for the total photon count rate in \(B\) as a function of rotation of the polarizer in \(B\)? (2) What about the coincidence count rate as a function of rotation of the polarizer in \(B\)? (3) Would you see any dependence on the orientation of the polarizer in \(A\)? (4) Despite the fact that the total photon count rate in \(B\) matches to that of the polarization-entangled case, is there polarization entanglement? Why or why not? (To explain your answer, work the probability of coincidences using the same method in the pre-lab, but now accounting for the input state \(\ket{H}_a\ket{H}_b\) and accounting for the quarter waveplates in each arm. Note whether the state before the polarizers is factorizable or not.)
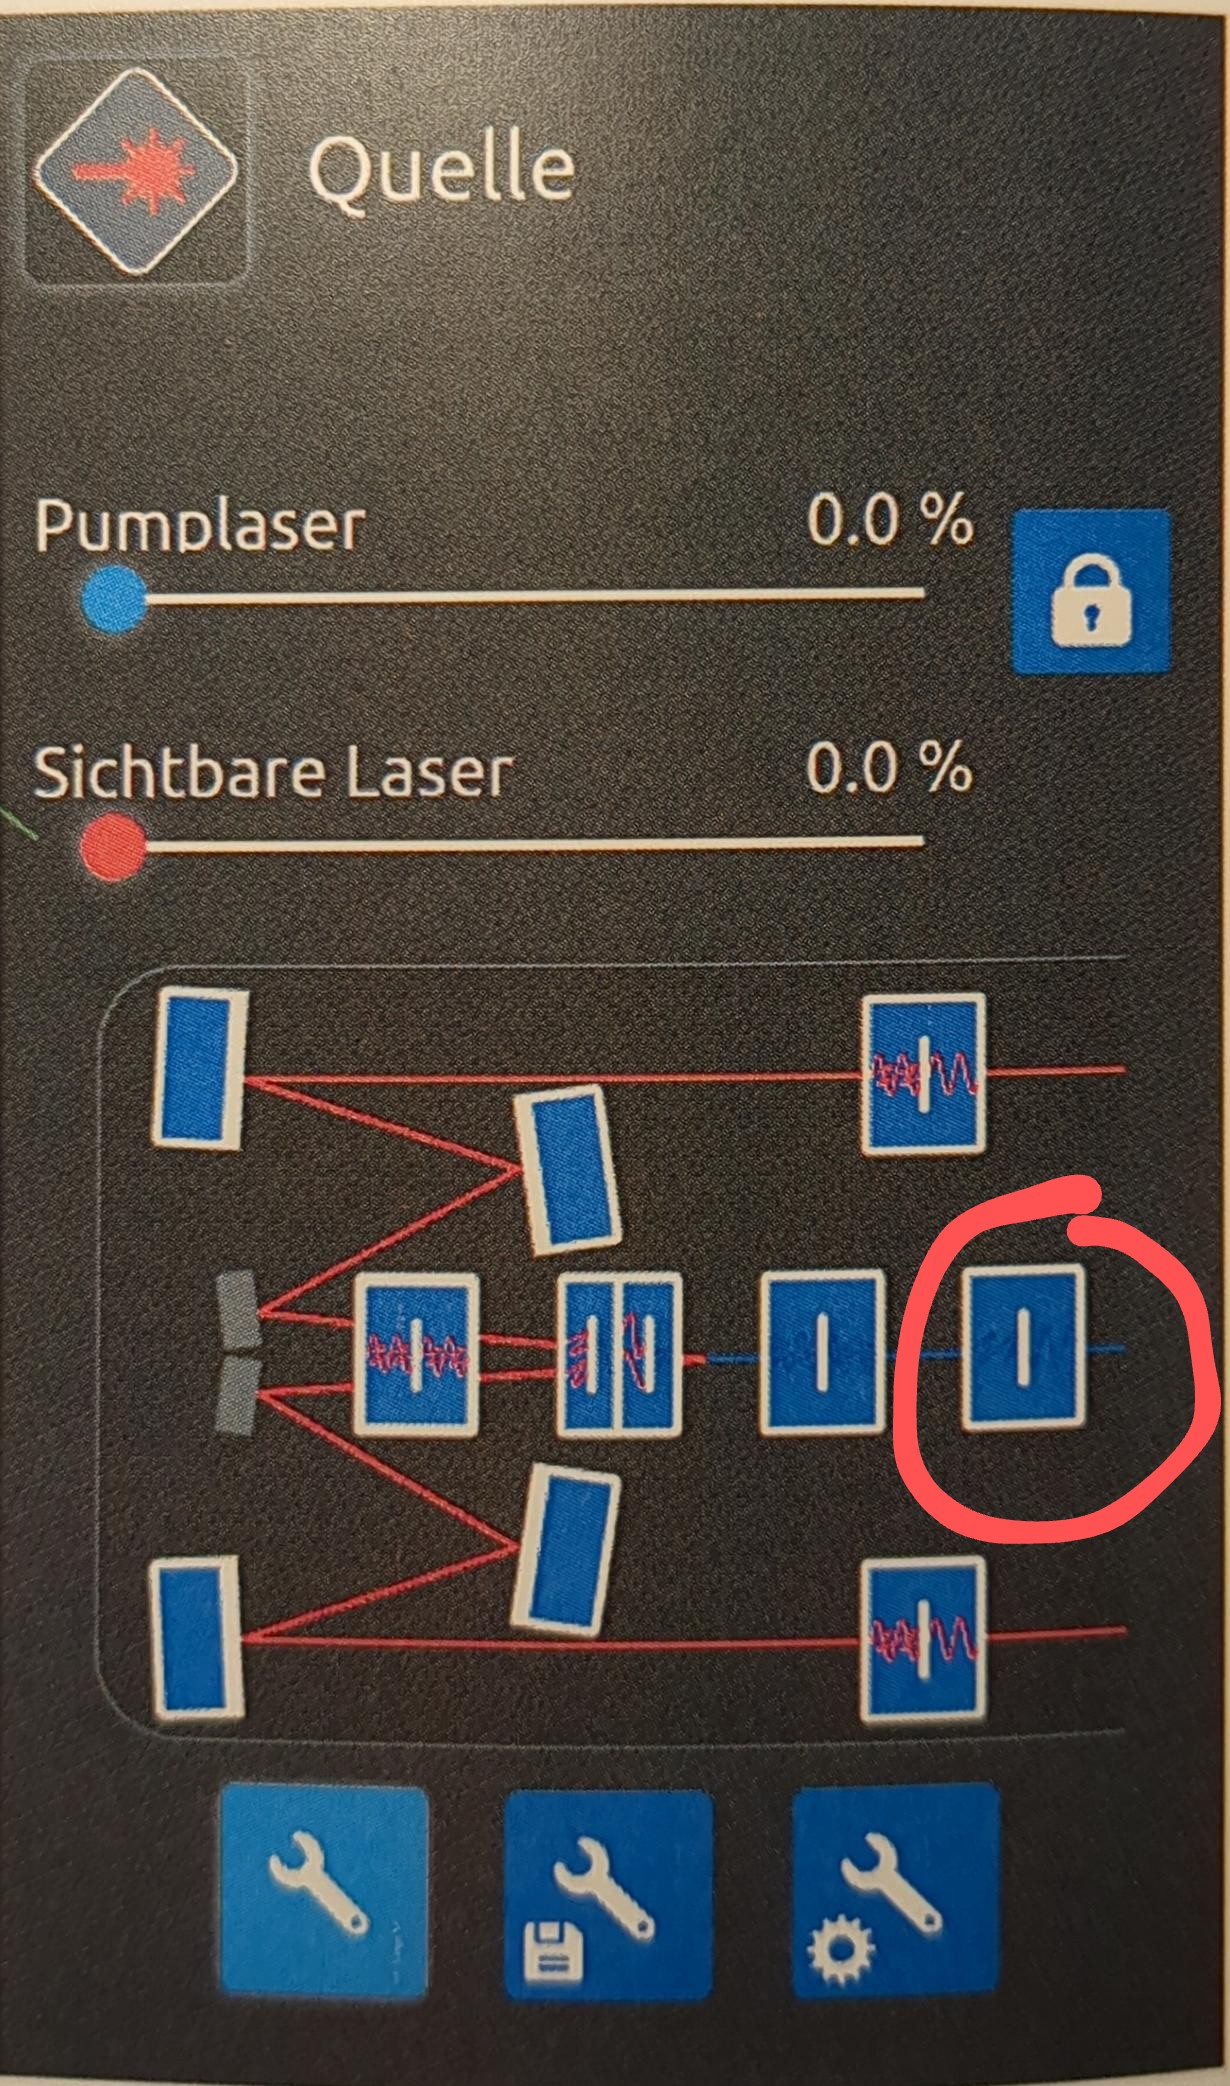
Fig. 19 The HWP control is circled in the source control dialog. Use this to set the polarization angle of the source.#
Aim 5: Single-Photon Interference (Day 3)#
In this ecxercise we will build an interferometer to perform single-photon interference. We will use these measurements to: (1) better understand the properties of interference in the context of quantum states of light; (2) explore the spectral bandwidth of the photons; and (3) demonstrate the concept of interaction-free measurement made possible through the wave-particle duality.
Before the lab, work through the prelab materials and watch the following video related to the concepts we will explore in this part.
Important
Before proceeding to these final labs, you must have received training from the instructional staff regarding fiber handling. You will be taught how to properly connect, cap, and clean the fibers. The fibers are sensitive and should be handled with care (especially since we want to detect every photon we can).
The instructor/TA will also review the fiber-connection layout for the Quantenkoffer and fiber-interferometer setup.
If at any point you are confused, please ask the staff to help!
Lab Exercise#
Note
For these last two lab exercises the instruction staff have modified the quantenkoffer so that the \(A\) and \(B\) detector ports are fiber-coupled to the outside. This reduces some burden in alignment, and you do not have to use the periscope ports at the right hand side of the board.
We will be working with fiber-couplings, and there will be a brief discussion at the beginning of the lab about proper handling of fibers so that they are not damaged and remain clean.
Part 1: Single-Photon Interference#
Step 1 Construct the system as shown in Fig. 20. The important thing is that we need a motorized wedge in each arm for delay control. The wedges control both phase and group delay. It is important that you use the wedges with the larger motors that move more slowly so we can see the interference.
Before starting the procedure below, set your single-photon source to have a single horizontal polarization. Do this by setting the source waveplate to vertical (see Fig. 19).
For alignment purposes, use the following procedure.
Turn the red adjustment laser on to full power
Direct the beam from one port to a beamsplitter using a 45 degree mirror
Place a wedge just after the transmitted and reflected arm
Using the alignment target, make sure the transmitted beam is aligned to the target with the 90 degree mirror
Now do the same on the reflected path using the beamsplitter
Now place a fiber mount on each arm. Direct the output of one arm to the detector F input port (or optionally, you could use the fiber input port for detectors A or B – you just need a detector to monitor signal). Use the fiber mount adjustments to optimize signal.
Turn the adjustment laser off and then fine tune the single-photon alignment.
Now repeat 6 and 7 for the other arm.
At this point, you should see roughly half the total signal (on the order of 100-150 thousand counts per second) in each arm after the beamsplitter. If not, then it may be that: (1) a fiber head needs cleaning; or (2) you need to fine-tune the alignment.
Attach the output fibers to the corresponding input of the fiber interferometer setup shown in Fig. 21. Note the fibers and inputs are labeled HOM1 and HOM2. It is very important that you attach the correct fiber to the correct port here as the fiber lengths have already been carefully compensated. This will prevent a long search for timing overlap.
Attach one of the fiber interferometer outputs to the fiber going to detector A,and the other going to detector B like shown in Fig. 22. To ensure maximum throughput, block one arm of the fiber interferometer at a time (you can use an edge of the gray polarizer cards), and tweak the pointing direction of the other input XY mount to optimize output signal.
Switch arms and repeat step 11.
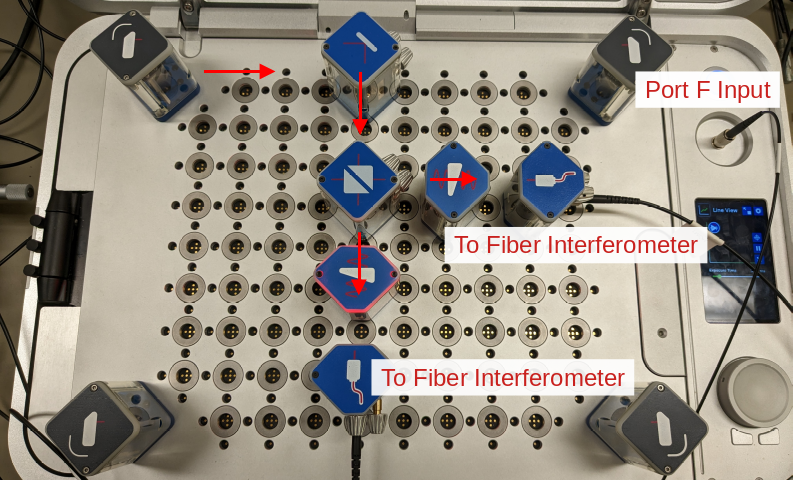
Fig. 20 The Quantenkoffer board setup fot the single-photon interference measurement. The single-photon source from A is split by the beamsplitter on the board. Each arm is directed to a fiber-coupled mount. These two fibers are then routed to the fiber-interferometer setup as shown in Fig. 21#
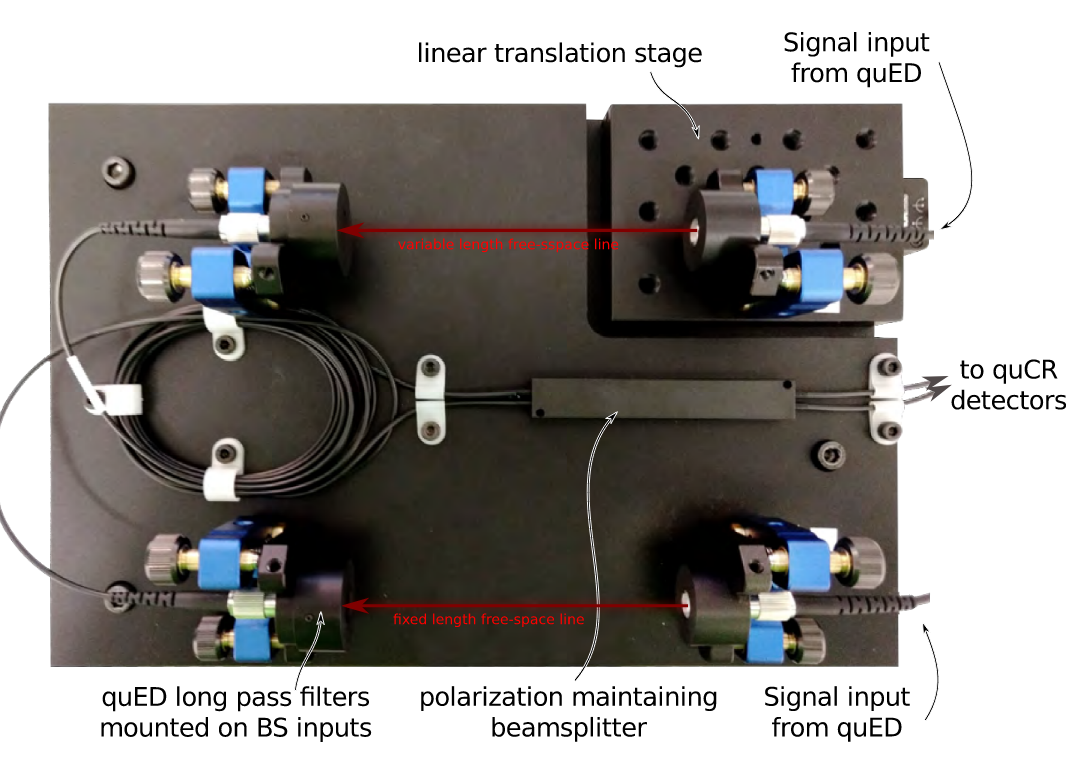
Fig. 21 The fiber interferometer used for aims 5 and 6. It consists of two inputs and two free-space gaps. The top input is mounted onto a micrometer delay stage that can be adjusted to find the overlap of the photon wavepackets for observing interference effects.#
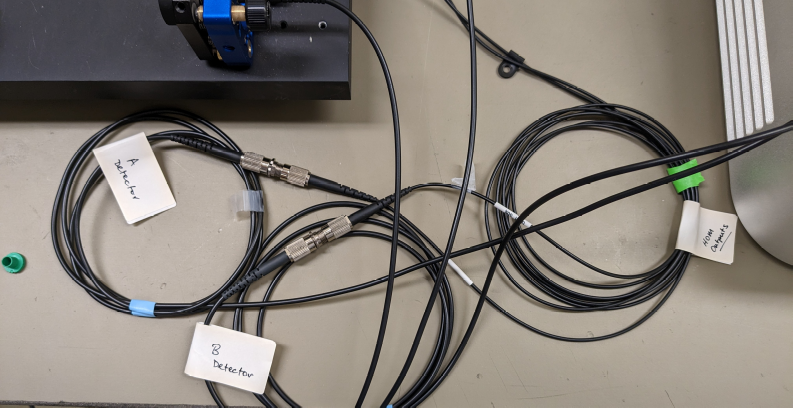
Fig. 22 Final connections of the fiber interferometer outputs to the fibers going to detectors A and B.#
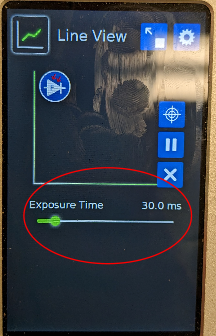
Fig. 23 Setting for the exposure time found in the control menu for the line-plot readouts. Set this to a low value (10-20 ms) so that you can quickly find the overlap position with the micrometer stage.#
Step 2 Look for single-photon interference
Using the control menu for the three-line output trace view, set the exposure time to a low value of 10-20 ms (see Fig. 23). This will help us more quickly find time overlap.
For each wedge, make sure the position of the wedge is roughly centered.
The optimum delay should be close to a reading of 0.2 inches on the micrometer (see Fig. 24). Each full revolution of the micrometer is 0.025 inches (note there are 25 tick marks as you rotate it around). With the micrometer at 0.2 inches, scan one of the wedges fully through all posistions looking for interference.
If you do not observe interference, move the micrometer by roughly one half revoltuion more than 0.2 (0.2125). Move the wedge through again.
Keep repeating (5) until you see the interference. If you do not see it after a while, you might very, very slowly move the micrometer looking for signs of interference. You might also need to move slightly below 0.2. Be persistent – you will find it. But the key is to take your time and move slowly.
When you observe interference, stop the wedge movement and note its position.
Having noted the position of the wedge, you can scan through the interference fringes and record the trace outputs for A and B simultaneously. An option here is to set the wedge to oscillate around the zero-delay position. To adjust the max/min oscillating positions, use a one finger swipe on the small control screen to adjust one, and a two-finger swipe on the small control screen to adjust the other. This oscillating movement will create a repetitive trace of the interference on the readout.
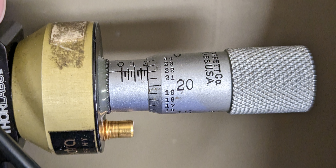
Fig. 24 You can read the micrometer position in milimeters (each rotation is 0.025 in, with a tick size of .001 in). The overlap position is usually around 0.2 in.#
AIs (1) From this measurement, you can you determine the frequency bandwidth of the photons. It is related to the inverses of the total time delay over which you observe interference. Use your measurements to estimate this bandwidth noting precisely how you did it. (2) Assuming a central wavelength of 810 nm, then what range of wavelengths do the photons contain based on the bandwidth you calculate? (3) Discuss the phase relationship between the outputs to detectors A and B and why this makes sense. (4) Is your interference contrast the same as your calculations indicate it should be from the prelab? What experimental conditions might be limiting your contrast compared to theory?
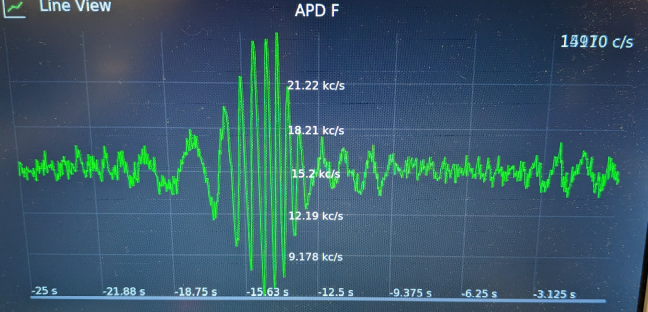
Fig. 25 Scanning through delay position with a wedge to see single-photon interference at an output port. The interference scan on each output port should look similar to this.#
Part 2: Interaction-Free Measurement#
Now we will use the interferometer to demonstrate the concept of interaction-free measurement. For the case of single photons, it is possible to detect the presence of an object in one of the interferometer arms without actually interacting with it. If the interferometer is aligned on a null, an object placed into one of the arms will casue the signal at the output to increase. These photons sensed the presence of the object, without being absorbed!
Stop the wedge and move it to a region of large interference.
Use the spinning control knob to jog the wedge to a position such that the interferometer is on a null in one of the ports.
Now take an opaque object and slide it in and out of one path of the interferometer.
If the conditions are right, and the vibrations in the interferometer low enough, you should see the signal increase each time the object is placed within the beam as shown in Fig. 26. If the interferometer is drifting, you could take a video of the trace observing both detector ports. This would increase your changes that you observe this effect.
AI Record the relative count rates for each case (object, no object) and compare to your pre-lab calculations. Is the effect as pronounced as what you estimated? Discuss practical issues related to this method in practice.
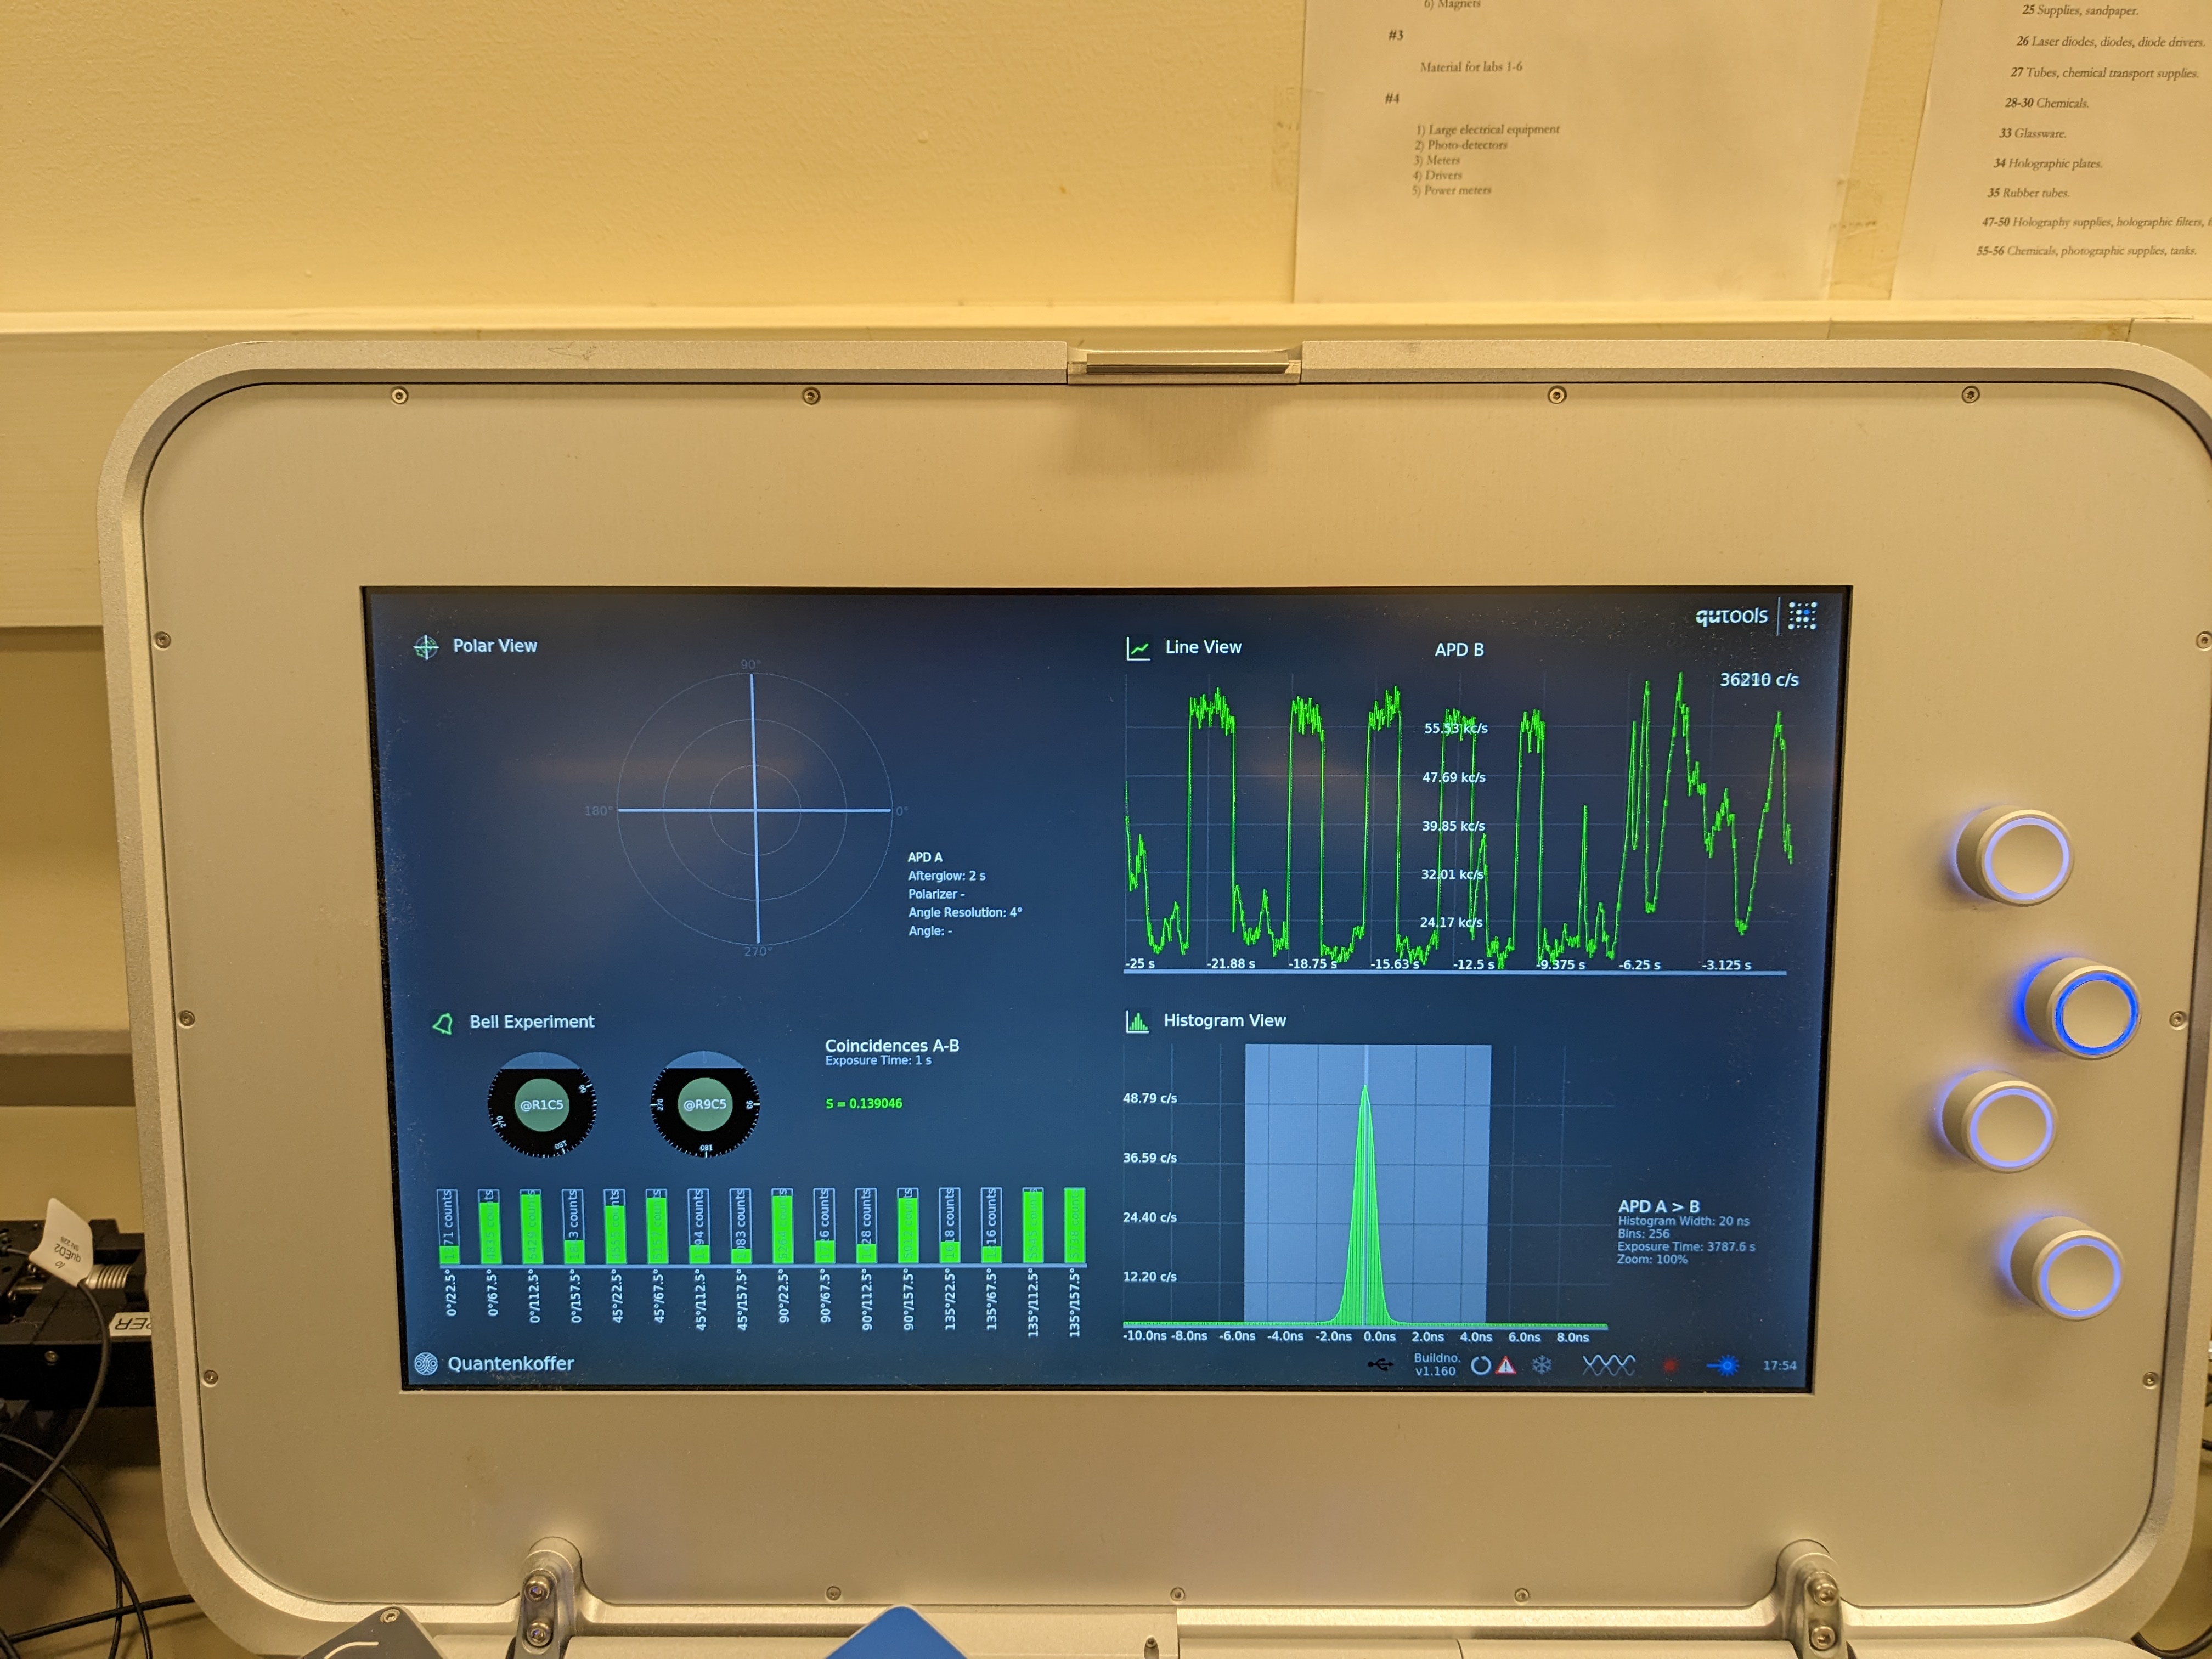
Fig. 26 Each time the object is placed in the beam, the signal in channel B increases. This is an “interaction-free” measurement.#
Aim 6: Interference of Two Photons and NOON State Generation – Hong Ou Mandel Effect (Day 4)#
In this lab we will interfere two single photons and observe the Hong Our Mandel effect which leads to photon bunching at the two output ports of the interferometer. The highly entangled output state forms a NOON state that have received interest for their potential application in quantum-enhanced sensing, which you will explore in detail as part of calculations in the post-lab.
The observation of strong photon bunching through the interference of two single photon states is not trivial. One significant complication is that the photons must be completely indistinguishable as they interfere on the beamsplitter. To achieve this, the spatial modes and temporal properties of the photons have to be well-matched.
In our case, both photons come from the same source which help us to ensure matched properties as they are emitted. To then ensure matched spatial mode profiles, we will interfere the photons within a single-mode fiber beam splitter. Since only the fundamental mode of the fiber can propagate, this ensures perferct matching of the spatial modes of the two photons.
The final on-board setup is shown in Fig. 27. Follow the following steps for alignment.
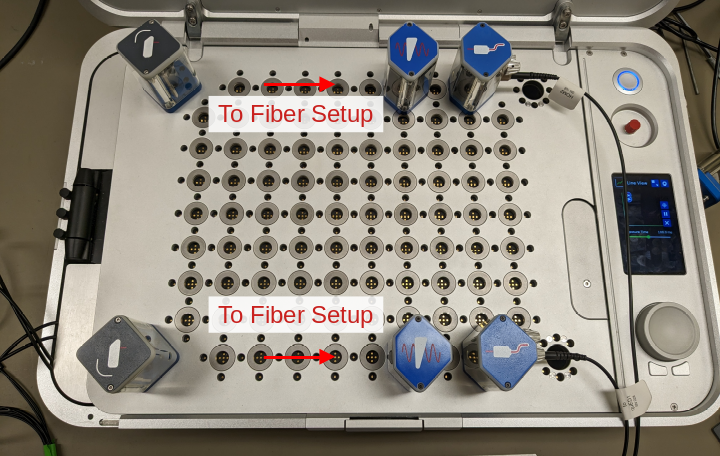
Fig. 27 Quantenkoffer board setup for the HOM experiment with outputs to fiber delay-line interferometer labeled. For the delay line, see Fig. 21#
Part 1: Align the fiber couplers.
The goal of this part is to couple the single-photon sources into two fibers.
Adjust the polarization of the source (see Fig. 19) to be vertical so that only H-polarized photon pairs will be generated.
Place wedges and fiber couples as shown in Fig. 27. Attach the outputs of each fiber directly to the fibers going to detectors A and B.
Use the fiber mount alignment to optimize the coupling of the adjustment laser and then single-photon sources into each arm.
From this point use the on-board source adjustments to optimize the signal and coincidences in A and B just as you would for earlier experiments. You should again find similar counts – roughly 300K in each arm, and 10-15K coincidences.
Part 2: Align the fiber beam splitter and look for the HOM dip.
The fiber beam-splitter component has two free-space arms, one of them with a delay stage. This is essential as for the HOM interference, you need to adjust the delay to find temporal overlap of the two photons. The goal of this part is to ensure that the free-space arms are aligned.
Attach the two single-photon ports to each input arm of the beamsplitter. It is very important that the fibers labeled HOM1 and HOM2 go to the corresponding input ports as the lengths have been calibrated. Be careful not to tug on the fibers as you might misalign the fiber couplers on the board.
Attach the output ports of the fiber beamsplitter to the detector ports for A and B like shown in Fig. 22.
Block one arm at a time of the fiber beamsplitter (you can use the edge of one of the gray polarizers to block the beam) and optimize the throughput of the fiber interferometer using the x-y positioning knobs of the input ports. When both ports are open, you should see between 1-2K coincidence with around 100K counts per second on each arm of the fiber outputs.
Now we can look for the HOM dip. The optimum delay should be close to a reading of 0.2 inches on the micrometer (see Fig. 24). Each full revolution of the micrometer is 0.025 inches (note there are 25 tick marks as you rotate it around). With the micrometer at 0.2 inches, scan one of the wedges fully through all posistions looking for the dip in coincidences. If you are using the fast wedges, set the movement speed to 50% so that it scans a bit more slowly. Important: Ignore any changes near the end of the wedge movement – there is always some misalignment at the edges of the wedge movement range. Important: If you use the fast weges, you cannot turn the speed below a certain threshold or the wedge will not move. It is safe to keep the velocity above 30 percent. Also, the jog dial (knob) does not move the position reliably – you must move the wedge via the touch control panel by sliding it.
If you do not observe interference, move the micrometer by roughly one half revoltuion more than 0.2 (0.2125). Move the wedge through again.
Keep repeating (5) until you see the HOM dip. If you do not see it after a while, you might very, very slowly move the micrometer looking for signs of the dip. You might also need to move slightly below 0.2 depending on the exact alignment. Be persistent – you will find it. But the key is to take your time and move slowly. Note: The dip is not always as pronounced as in the video below. To ensure a dip you see is real, move back and forth over it and make sure it is persistent.
When you observe dip, stop the wedge movement and note its position. If you need better statistics, you can increase the exposure time of the trace and further reduce the speed of the wedge.
AI (1) Record the trace of the dip through a full scan. (2) Move the wedge from one side of the dip to the other. By stoping the wedge on both sides of the dip right when it vanishes, you can note the rough distance over which you observe the dip. Record this distance. Measure it several times to get some statistics and a good sense of this distance.
Note
To improve the noise of your trace, you can optimize the coincidence timing and window. Observe the histogram of coincidences, and use the timing and coincidence window controls inside the detector settings to reduce to the minimum possible coincidence window so that you have the best signal to noise ratio.
Here is a video moving in and out of the HOM dip so that you get an idea of the visibility that is achievable.
AIs (1) What is the spatial length over which you see the HOM dip? What does this correspond to in terms of optical delay? (Note you have just measured the delay between two single photons with sub-picosecond resolution!) (2) How strong is the dip as a percentage of total coincidences when not overlapped? Why might this contrast not be 100 percent? (3) Returning to the histogram width from aimns 1-3, can you now conclude whether the coincidence timing histogram is electronics limited or photon arrival time limited? (4) Read the section in the text extending this approach to perform N=2 NOON-state interferometry and be sure to complete the post-lab questions. The experiences gained in this measurement should help inform your answers to this post-lab with regard to engineering challenges involved with generating and using higher-order Fock and NOON states.
Project Idea Quantum-Enhanced Measurement with a NOON State Interferometer#
You might be interested in using the NOON states that you now know how to generate to demonstrate quantum-enhanced sensing (or maybe for some other application). While challenging, it is possible. The video below demosntrates superresolution on the Quantenkoffer – maybe you could demonstrate supersensitvity?
