TEXT - Introduction to single photons with the quED (Week 1)#
In this text, we’re going to go over some of the basics of working with single photons, especially how they relate to the quED experimental setup. We’ll start with a single photon source, which you’ll be using in the lab. Then we’ll talk about how to detect single photons.
Next, we’re going to treat photons as indicidual particles, and we’ll show how to verify that a source is indeed producing single photons. You’ll reproduce that experiment in the lab.
Finally, as time allows, we’ll look at single-photon interference.
Hanbury Brown-Twiss & Second order coherence \(g^{(2)}\)
classical
quantum
Single photon source: Spontaneous Parametric Down-Conversion (SPDC) #
First, let’s take a high level overview of how spontaneous parametric down conversion (SPDC) works. SPDC occurs when a pump photon is converted into 2 photons of less energy. Traditionally, one output photon is called the signal and the other is called the idler.
Phase Matching Conditions#
One important feature of SPDC is the fact that it always obeys energy conservation: the energy of a pump photon before SPDC occurs is equal to the sum of the signal and idler photons after SPDC occurs.
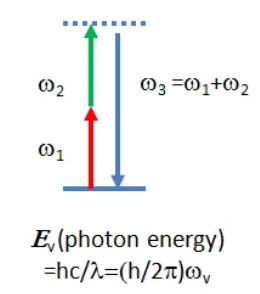
Fig. 36 Image from HC Photonics.#
Another important feature is that the momentum after SPDC must be the same as the momentum before SPDC to satisfy conservation of momentum.
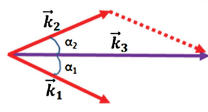
Fig. 37 Image from Couteau’s review paper.#
Recall that momentum is a vector, so the magnitude and direction need to be maintained. This is why we see that the signal and idler photons in the quED are non-colinear (they travel in different directions): their sum still matches the pump photons.
Matching the momentum is an a challening part of generating SPDC. As you recall, \(\overrightarrow{k} = \frac{2\pi n}{\lambda}\) where \(n\), the index of refraction, is a function of \(\lambda\), the wavelength of the light. Choosing a material that has the appropriate index at the relevant wavelengths is challenging and involves looking at the dispersion relation, shown in figure Fig. 38.
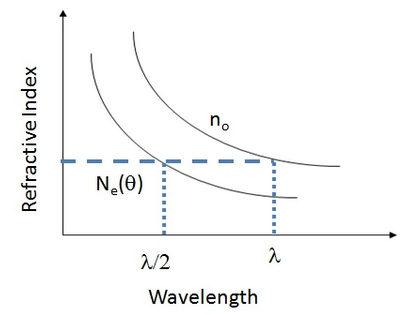
Fig. 38 Image from HC Photonics#
Additionally,matching the indices requires using different polarization for the photons, leading to different types of SPDC. Note that the image below shows classical nonlinear optical processes, so you’ll see that in some cases there is an input in the idler mode.
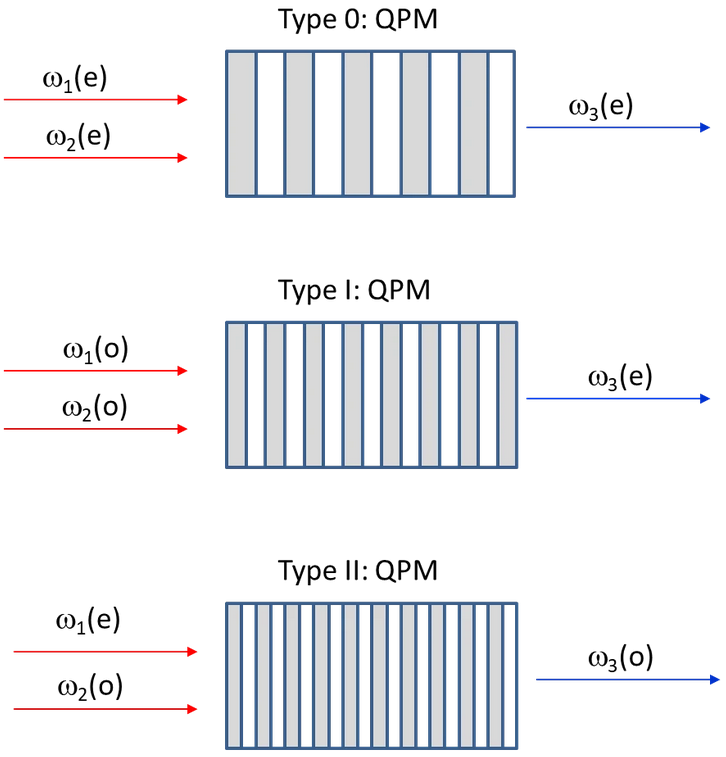
Fig. 39 Image from HC Photonics#
Knowing the types of SPDC is important when designing an SPDC source, but it’s also important when using the SPDC source. The quED source is from Type 1 SPDC, as show in figure {numref} quEDSPDCcone, an image from the quTools manual for the quED. Look at how the output from the crystal is a series of cones concentric around the pump laser. When collecting the light from the SPDC output, it’s important to make sure that the collection is of matching pairs from the same cone. Practically, the way to achieve that is by maximizing the the coincidence counts and not just the singles.
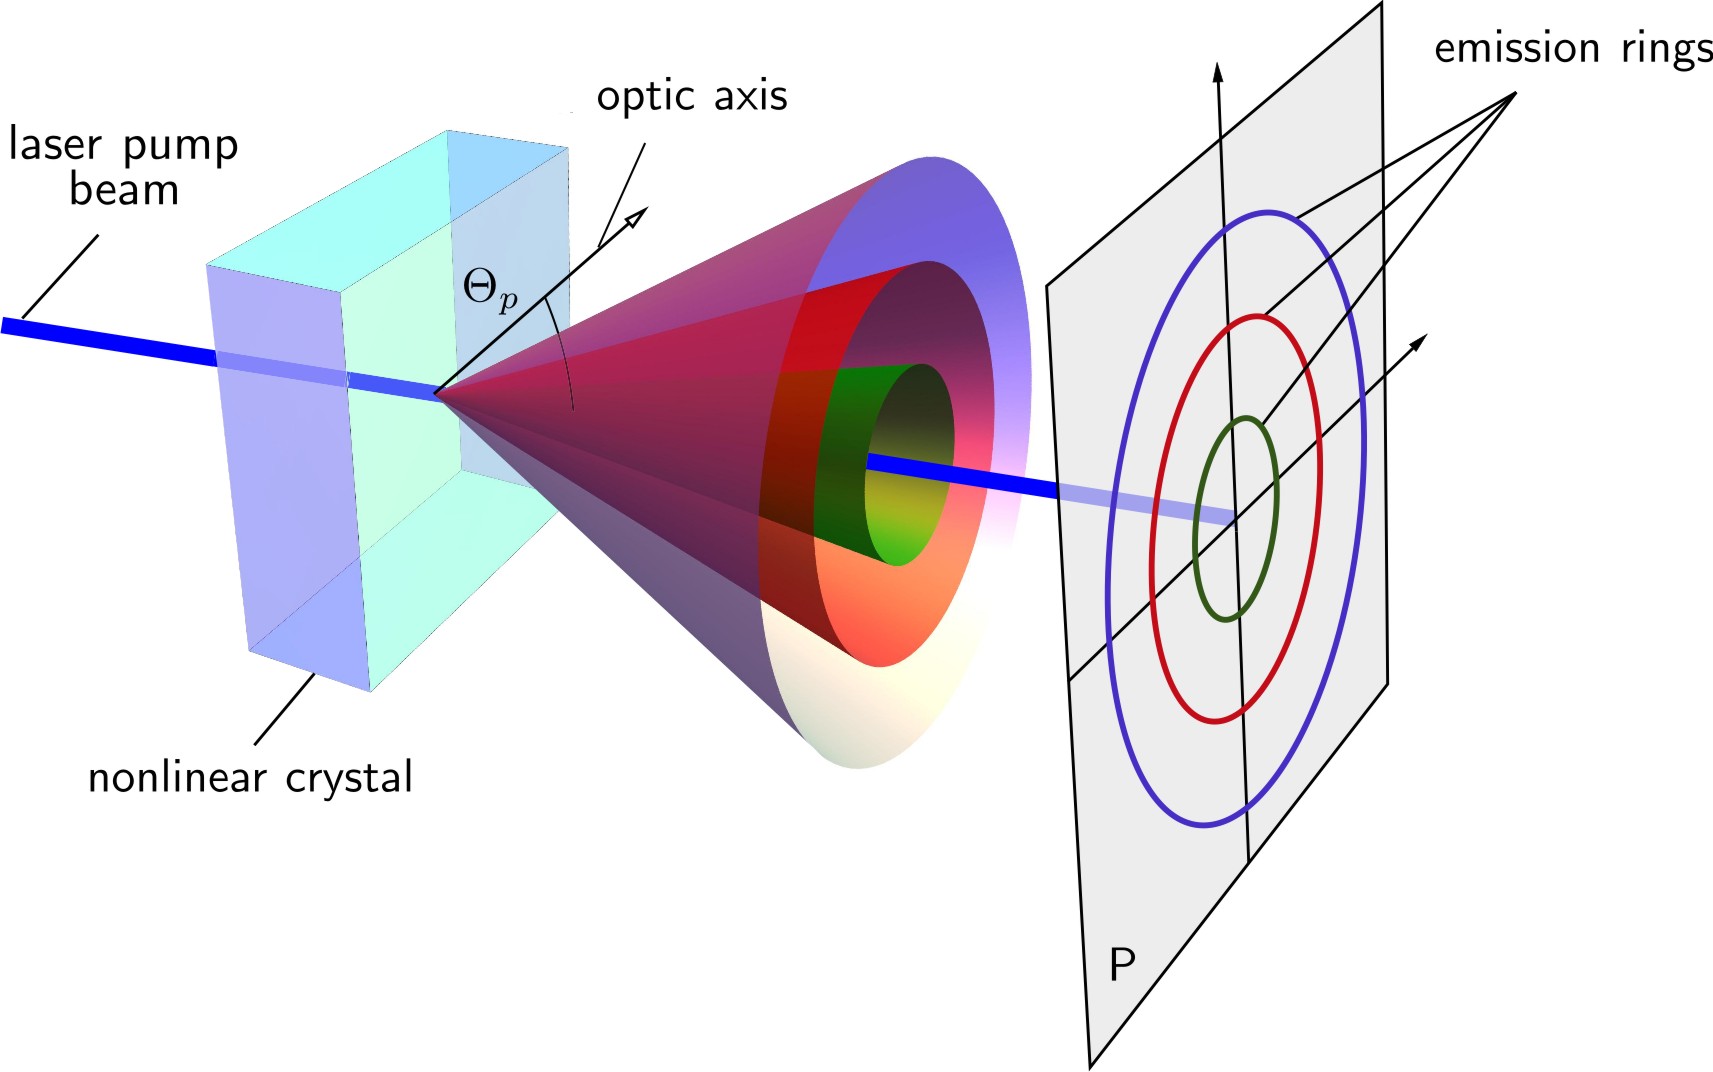
Fig. 40 Image from quED Manual#
Mathematical Description#
In terms of the quantum optics, it’s valuable to look at how SPDC can be described mathematically. First, let’s consider the initial state of the system before SPDC occurs. We have a very powerful pump beam, which we express as a coherent state with eigenvalue \(\alpha_p\). The signal and idler states are both vacuums, which are number states with 0 photons in them. So the initial state is given by
We obtain the interaction Hamiltonian \(\hat{H}_{si}\) from the expection of the pump laser field $\(| \alpha_p\rangle = \hat{D}(\alpha_p) |0\rangle \)\( where the displacement operator \)\(\hat{D}(\alpha_p)\)\( creates the coherent state in mode p. Let's assume \)\(\alpha_p \in \mathbb{R} \)$ to avoid some math tedium. Then, in the interaction picture,
where we define
\(\chi_{2}\) is the nonlinearity factor of the crystal and is given in (picometers)(Volts)\(^{-1}\). This tiny value is why SPDC is such an inefficient process. Even though our pump power is very high (\(\alpha_p >>0\)), we still have only \(~10^6\) photon pairs/second generation rate.
Here, we explicitly factored out the \(\hbar\) term to simplify the subsequent math since that \(\hbar\) will be canceled by the \(\hbar\) in the denominator of the time dependent Schrodinger equation, \(\frac{\partial}{\partial t} |\psi(t)\rangle = -\frac{i}{\hbar} H |\psi(t)\rangle\).
Classical Nonlinear optics#
Briefly, SPDC is a fundamentally quantum process: it can’t be described by classical nonlinear optics. In classical nonlinear optics, parametric ampification is the process where you combine a source with frequency \(\omega_p\) and another source frequency with \(\omega_i\) in a nonlinear crystal to generate a field at \(\omega_s = \omega_p - \omega_i\) and amplify the field at \(\omega_i\). This is similar to SPDC in that you’re generating light at a wavelength longer than the pump, but it’s disimilar in that it requires a non-zero input at \(\omega_i\). This is what makes SPDC spontaneous: the output at the signal and idler aren’t stimulated by any input because the input is in the vacuum state.
Further reading#
For a good overview of SPDC with additional details, this Review Article is recommended. Additionally, for more information about designing a system to produce SPDC, the HC Photonics PPLN GUIDE: Overview is very informative. For nonlinear optics, Robert W. Boyd’s Nonlinear Optics is an excellent textbook.
Detection #
The detectors in this class will mostly be treated as a black box: you put in some photons, you get out a count of the photons. However, if you’ve never worked with photodetectors, it can be helpful to look briefly at how detectors work.
Briefly, a photodetector uses a photodiode to generate a photocurrent, which can be amplified or measured directly. The high level understanding is that you shine a light on a device, and the light is absorbed and creates a current. Figure {numref} Detector below shows a basic cartoon of the process. A photodiode is a semiconductor device based on a crystal structure. In this type of crystal structure, one region has mobile electrons while another has mobile positive charges, called holes. When an incident photon (energy \(h\nu\)) has enough energy to overcome the bandgap energy \(E_g\), it can excite an electron and a hole enough that an applied voltage will move the charge carriers. This movement of charge generates a photocurrent.
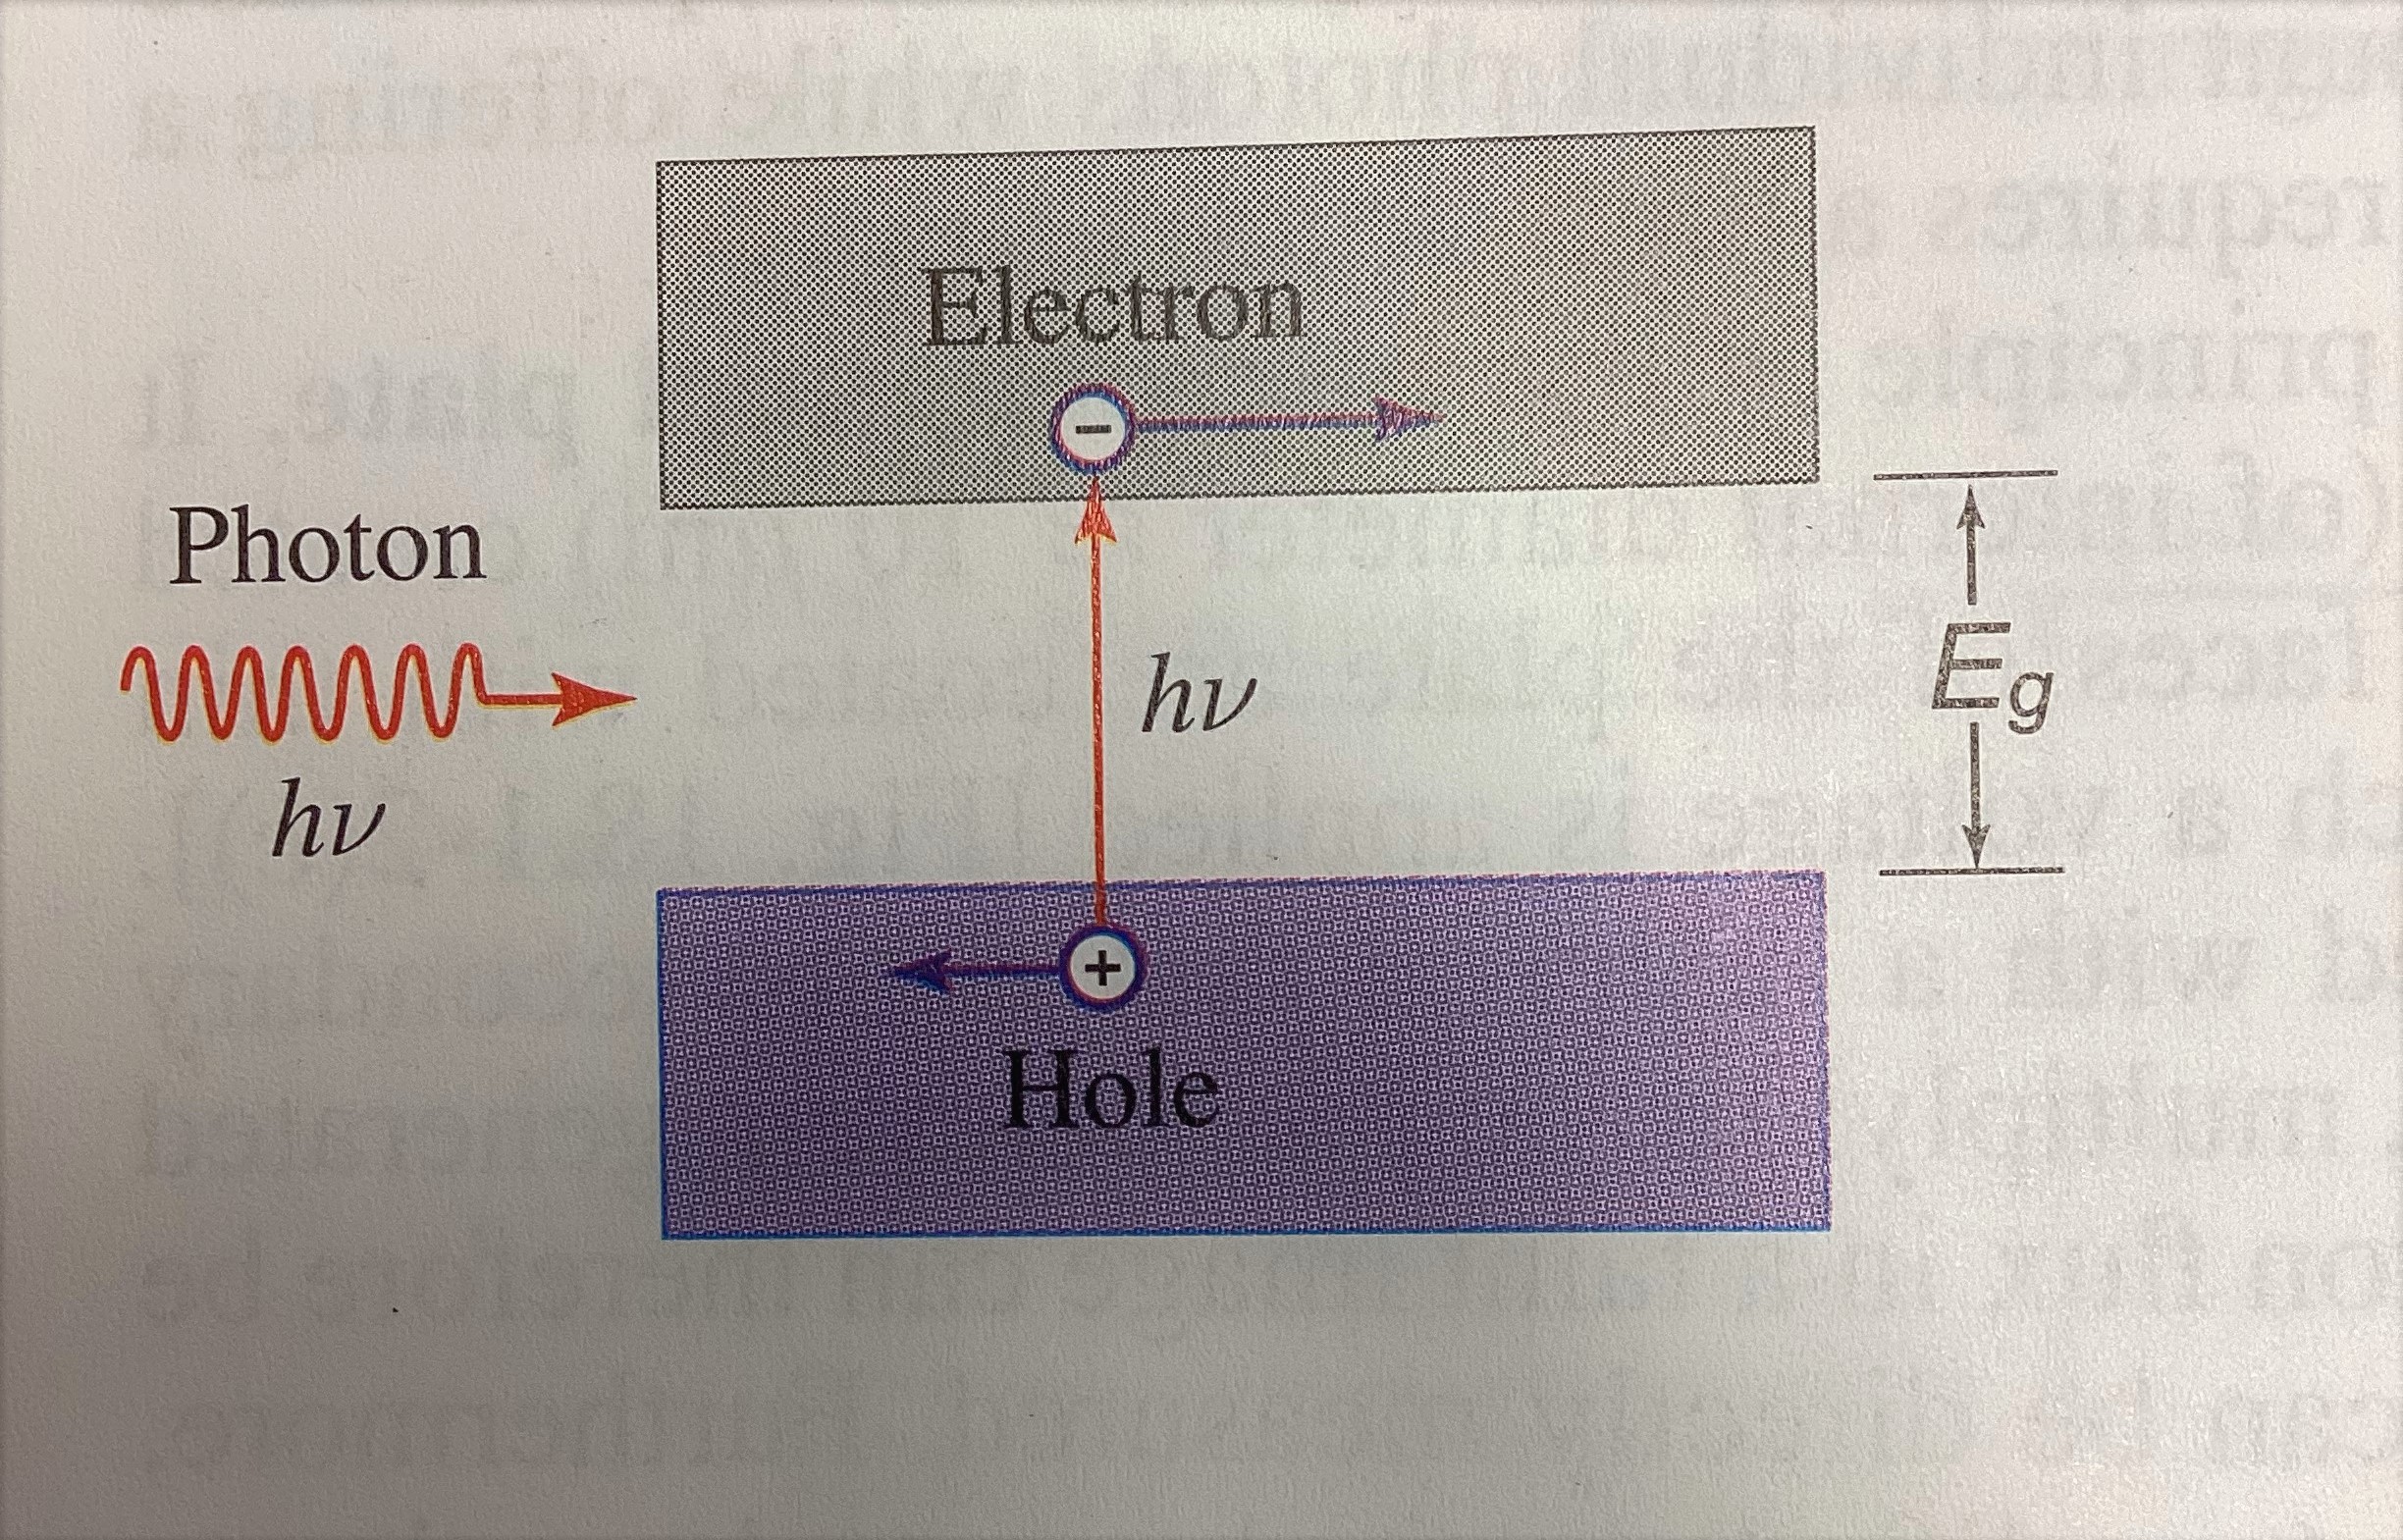
Fig. 41 Image from Saleh and Teich.#
Our particular device are avalanche photodetectors (APD). What makes them special is that they’re designed so that once an incident photon excites an electron and hole, that electron and hole excite an additional electron and hole, which excites an additional electron an hole. This creates an “avalanche” effect and makes it possible to measure single photons.
Second order coherence - \(\gtwo\)(0)#
Now that you know more about the source and detectors we have available, let’s look at our first experiment to measure the second order coherence, \(\gtwo\). \(\gtwo\) is an important parameter when describing a light source, giving us information about how close the actual source is to an ideal.
Let’s first review the mechanics of a beamsplitter, an essential component in this measurement.
Recall a beamsplitter#
Consider a lossless 50/50 beamsplitter with indpendent inputs \(\ahat\) and \(\bhat\). The outputs \(\chat\) and \(\dhat\) are defined as
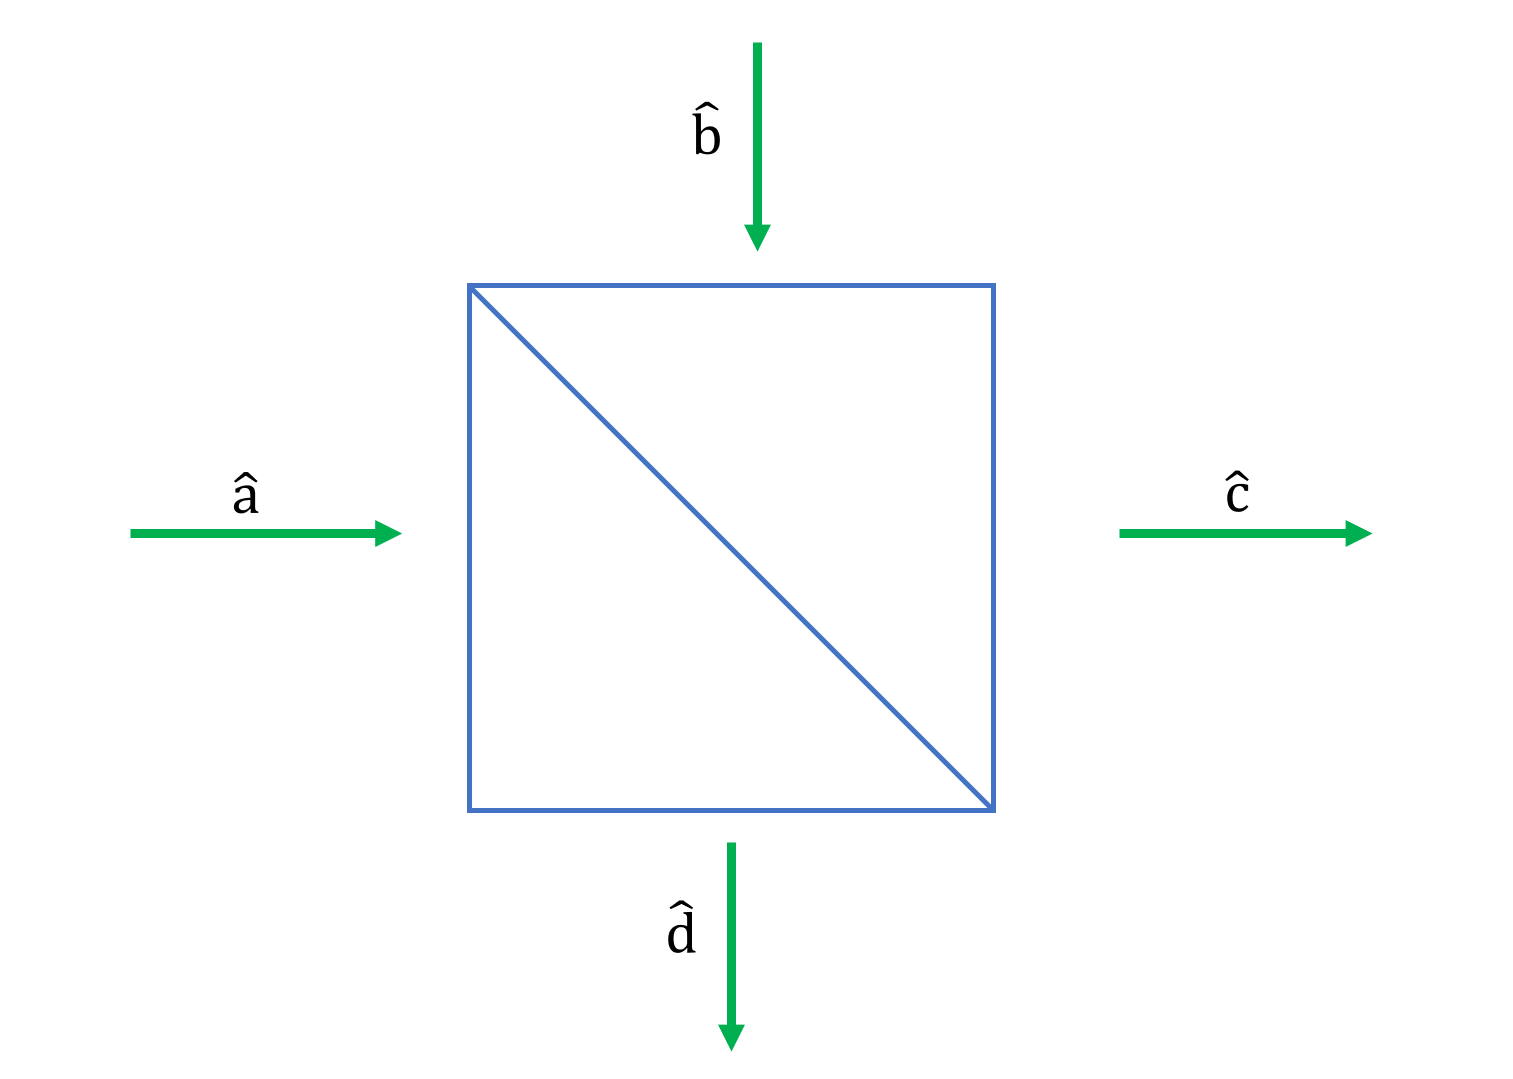
Fig. 42 A beamsplitter.#
The operators of each field \(\ahat\) and \(\bhat\) satisfy the boson commutation relations
and that \(\ahat\) and \(\bhat\) are independent fields, ie
You can verify that the outputs follow the same pattern and that the commutation relations are maintained.
and
Hanbury Brown-Twiss (HBT) Experiment#
The Hanbury Brown-Twiss (HBT) experiment was first conducted by astronomers, but it’s now used in quantum optics. The schematic is show below. There’s a 50-50 beamsplitter, and only one input port, \(\ahat\) has light shining in. The other input port, \(\bhat\) is in a vacuum state. The measurement is taken by putting detectors at the output ports \(\chat\) and \(\dhat\) and measuring the singles and coincidences.
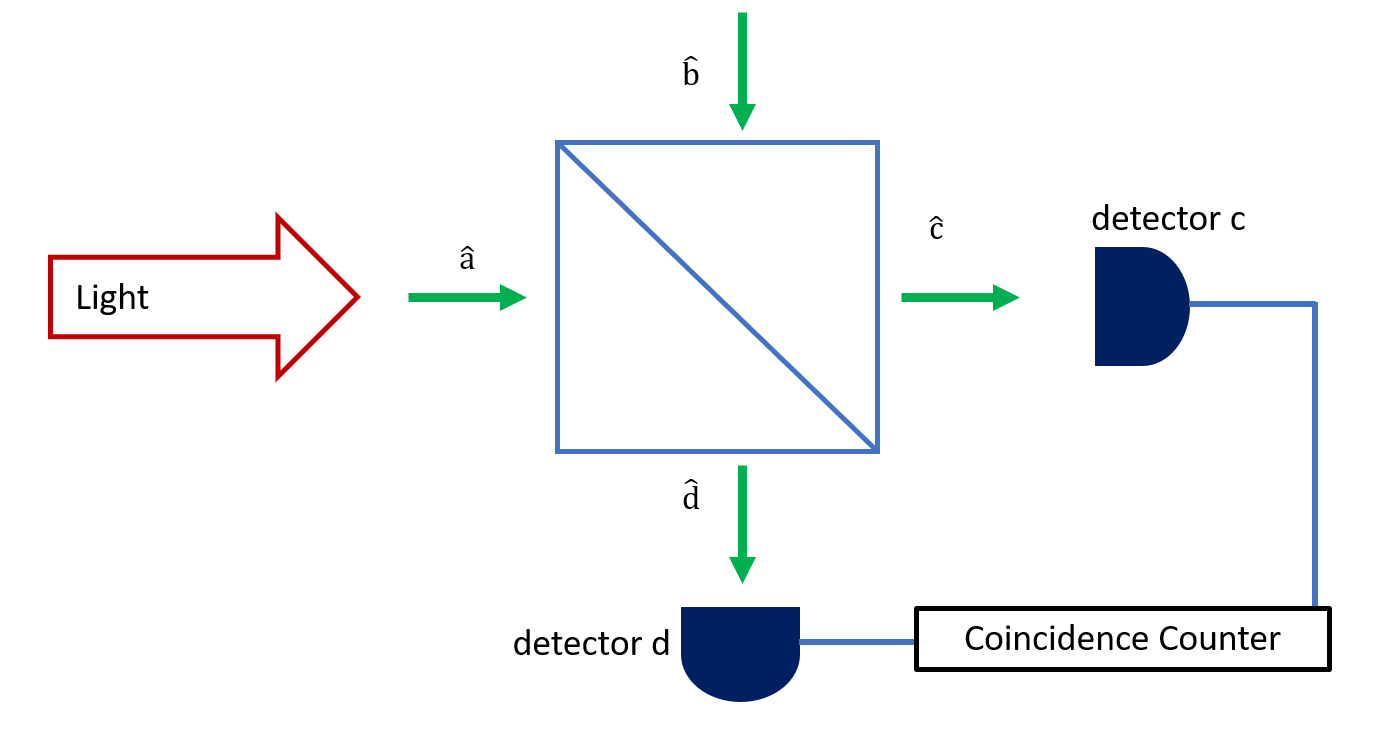
Fig. 43 Schematic of the HBT setup.#
First, let’s look at the experiment in one particular case, when the input light is in the single photon number state.
Coincidence with a single photon#
Specifically, we want to know how often we get a photon at both \(\chat\) and \(\dhat\) simultaneously. We call this a coincidence meaning an event where 2 (or more) detection events occur within a short period of time (on the scale of a few nanoseconds) on 2 separate detectors. Looking at coincidences is an important measurement in quantum optics.
What is the coincidence of \(\chat\) and \(\dhat\)?
So we see in the case with a single photon input into a beamsplitter we expect 0 coincidences. Conceptually this makes sense: a single photon can only go through one of 2 paths in the beamsplitter. If we look at both outputs of the beamsplitter at the same time, we should only see a click on one of the outputs.
The video below works through this math step by step, in case you’d like to see how the operator math can be evaluated.
Second order time coherence#
The above exercise is a necessary step for finding the second-order coherence. The most general case assumes the detectors record events at slightly different times, ie the detection time at detector c is \(t_c\) while the detection at detector d is \(t_d\). This allows us to account for situations where the detectors are slightly different distances away from the beamsplitter.
If, as above, \(\bhat\) is in a vacuum state, for and \(t_c = t_d\), we can simplify to
Clearly, for the case of \(\ahat\) being in the \(|1\rangle\) state, we find \(g^{(2)}(0) = 0 \).
Heralded single-photon source#
The set-up we’ll see in the lab, however, isn’t a case with single photons. SPDC is a heralded single photon source. That means that if an idler photon is generated, it’s extremely likely we’ll measure a corresponding signal photon. Due to issues like multiple pair emissions in the crystal and detector-related issues like dark counts and stray light, it’s not a 100% correlation, but the probability is still very high.
The result is that the \(\gtwo\) we’re interested in is conditioned on detecting an idler photon in the other arm, as in the image below. That is to say that we only want to look for coincidences between the two signal detectors when there is also a detection event in the idler detector.
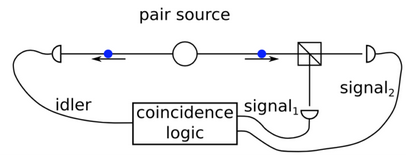
Fig. 44 Image from quTools.#
The \(\gtwo\) measurement is now conditioned on the idler detection at time \(t_i\), which we is expressed the following
where the “pm” subscript tells us to wait post-measurement to select which detections to use. The formal math is worked out in Bocquillon et al, PRA 79 035801 (2009) and Razavi et al, JPhysB 42 114013 (2009), but we’re going to approach this conceptually.
First, let’s look at the numerator term, \(N = \langle\hat{n}_c(t_c)\hat{n}_d(t_d)\rangle_{pm}\). Effectively, we’re saying that we’re looking at coincidences at c and d only in the case we make a measurement at i. So, that means we’re looking for three-fold coincidences \(\langle\hat{n}_c\hat{n}_d\hat{n}_i\rangle\).
We want to normalize this to what we would expect if we were measuring uncorrelated light. For detector \(j\) where \(j = c, d, i\), we say that the measured singles, \(N_j\), over a measurement time \(T\) is equal to the probability of getting a count, \(p_j\), multiplied by the number of coincidence bins, \(\frac{T}{\Delta_w}\) where \(\Delta_w\) is the coincidence bin width. That is
Now, for uncorrelated light sources, we expect the probability of three-fold coincidences over time \(T\) to be equal to the product of the probabilities
However, our setup makes it easier for us to measure two-fold coincidences. So, let’s consider the probability of a three fold coincidence in the following way:
Similarly as above, we’re assuming that the expected number of coincidences \(N_{12}\) over time \(T\) with coincidence window \(\Delta_w\) is given by \(N_{12} = p_{12} \cdot \frac{T}{\Delta_w}\), which means that
Now we have an expression for \(p^a_{icd}\) which gives us the probability of getting a three-fold coincidence during coincidence window \(\Delta_w\). This expression is in the form of \(\Delta_w\), total measurement time \(T\), and the number of two-fold coincidences \(N_{ic}\) and \(N_{id}\) as well as the total number of idler counts in that time, \(N_i\). Now, to get from the probability to the expected valued, we multiply by the total number of coincidence bins over our measurement time, \(\frac{T}{\Delta_w}\), which gives us the following:
Now, going back to \(\gtwo\), we now take the ratio of our measured \(N_{icd}\) compared to what we expect for independet light sources, and we get
The video below is a lecture that nicely walks through how you look at the \(\gtwo(0)\) measurement of a heralded source. The relevant part is about 20 minutes long, and it’s based on straighforward probability and developing physical intuition about the HBT experiment.
Sources and further reading#
Saleh and Teich, Fundamentals of Photonics
[Bocquillon et al, PRA 79 035801 (200p](http://dx.doi.org/10.1103/PhysRevA.79.035801
quTools HBT manual: https://www.qutools.com/files/quED/quED-HBT/quED-HBT-manual.pdf
quTools secret HBT manual: https://www.qutools.com/files/quED/worksheets/qutools_HBT.pdf
[M. Beck, J. Opt. Soc. Am. B 24, 2972-2978 (2007)]https://opg.optica.org/josab/abstract.cfm?URI=josab-24-12-2972
Loudon, The Quantum Theory of Light
Fox, Quantum Optics: An Introduction
Gerry and Knight, Introductory Quantum Optics
Pre-Lab Questions#
Before coming to the lab for the HBT experiment, please complete these pre-lab questions and be ready to show your work. If you have questions, ask the instructor before starting the lab.
What is \(\gtwo(0)\) for a number state with 2 photons? What about with 3 photons? Generalize this to Fock state \(\ket{n}\) with n photons and plot \(\gtwo(0)\) as a function of n.
What is \(\gtwo(0)\) for a coherent state \(\ket{\alpha}\)?
Bonus: What is \(\gtwo(0)\) for a thermal state?
